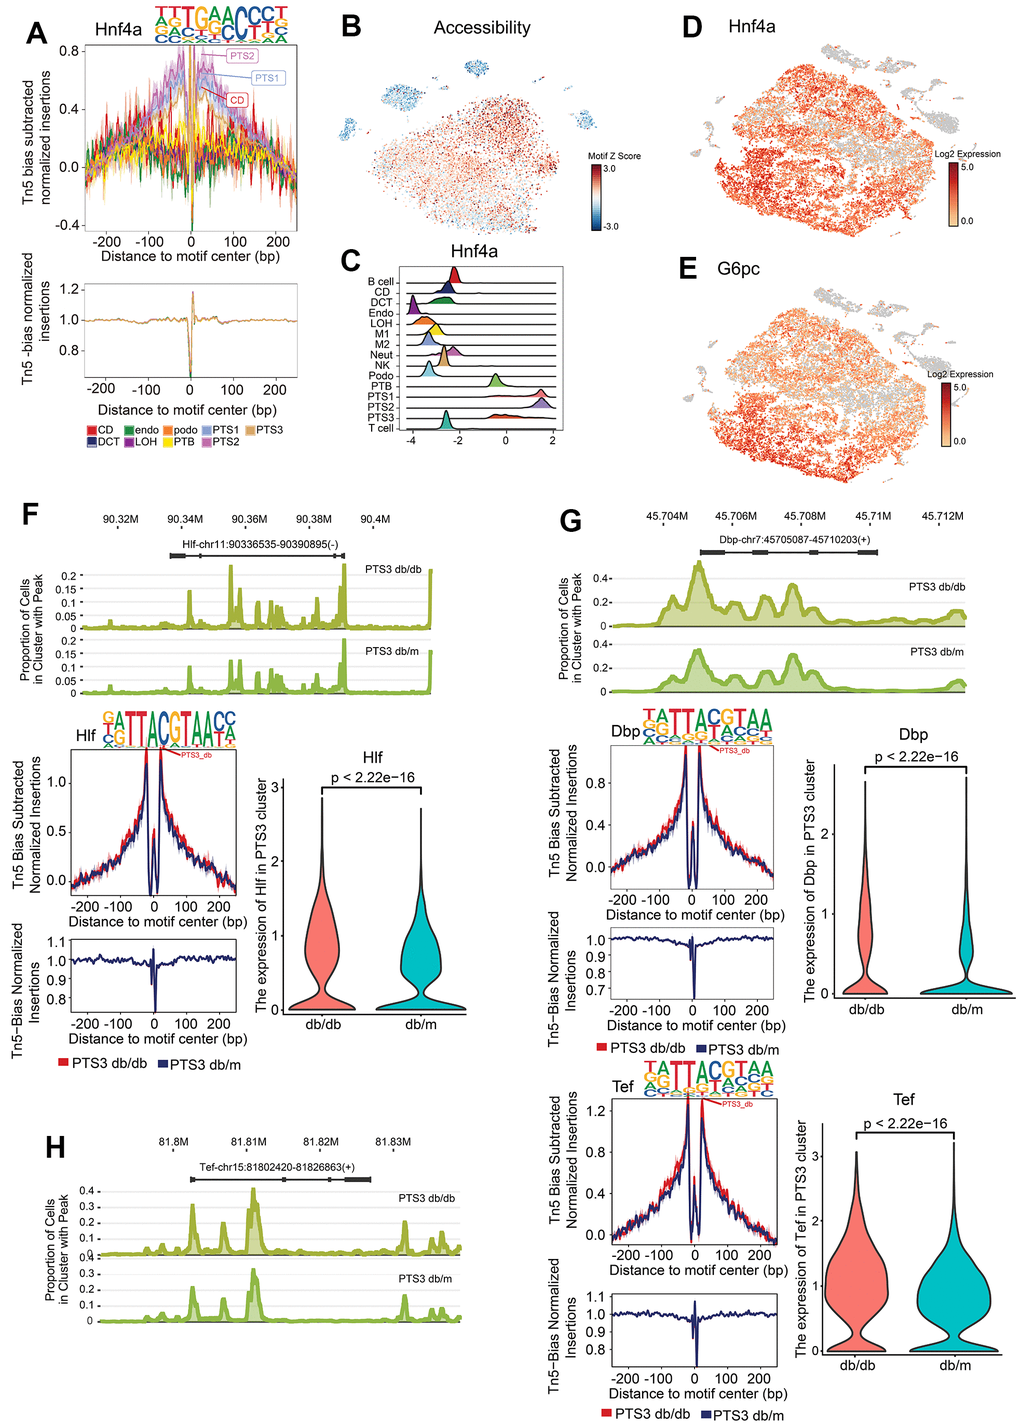
Figure 5.Specific transcription factors in the proximal tubules. (A) Footprinting of Hnf4a. (B) The chromatin accessibility of the region that Hnf4a bound was visualized using tSNE, with the accessibility level indicated by color intensity. (C) Differential motif enrichment analysis of Hnf4a: density map showing the distribution of motif deviation coefficient values. (D, E) Expression of Hnf4a and G6pc (target gene of Hnf4a), with the expression level indicated by color intensity. (F) Peak distribution, footprinting, and expression of Hlf in the PTS3 cluster of db/db and db/m mice. (G) Peak distribution, footprinting, and expression of Dbp in the PTS3 cluster of db/db and db/m mice. (H) Peak distribution, footprinting, and expression of Tef in the PTS3 cluster of db/db and db/m mice.