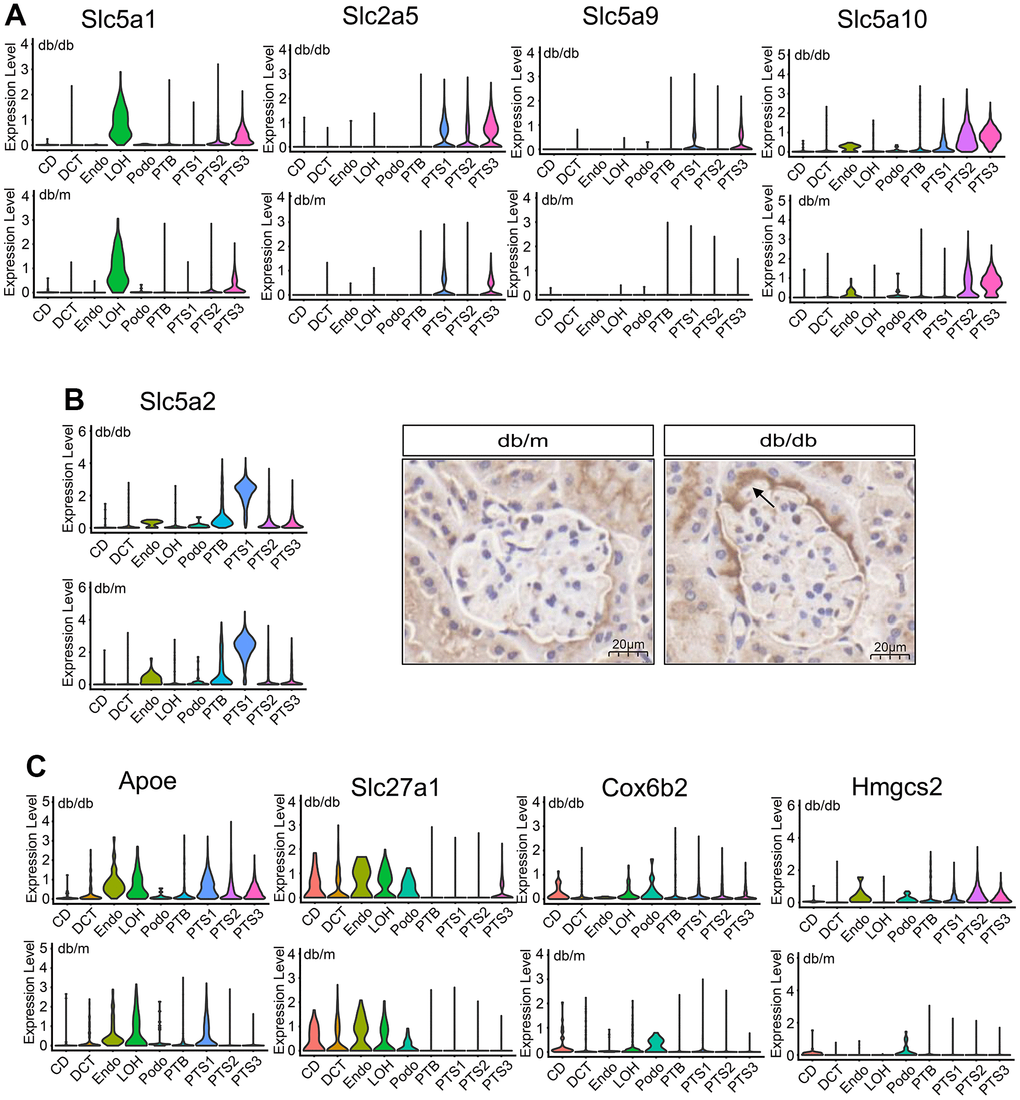
Figure 3.Metabolic changes in the renal tubule cells of db/db and db/m mice. (A) Violin plots showing the expression of glucose transporter in db/db and db/m mice. (B) Violin plots and immunohistochemical staining results of the expression of the Slc5a2 (SGLT2) transporter in db/db and db/m mice. Scale bar, 20 μm. (C) Violin plots showing the expression of Apoe, Slca27a1, Cox6b2, and Hmgcs2 transporters in db/db and db/m mice.