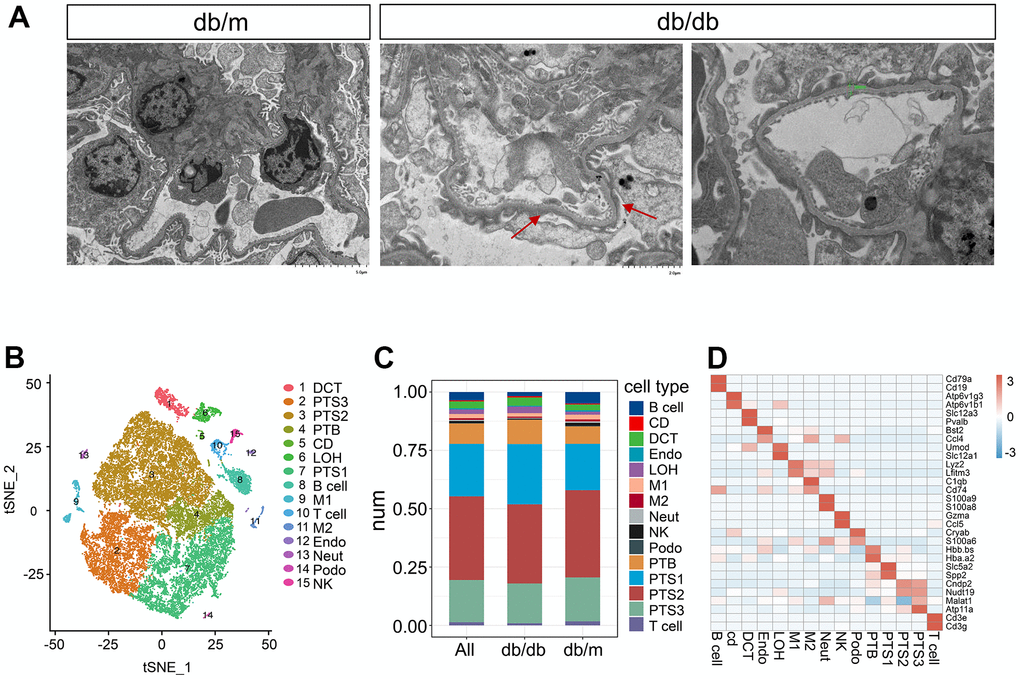
Figure 1.Single-cell transcriptome analysis in db/db mice. (A) Transmission electron micrographs of glomerulus from db/db and db/m mouse kidneys. The red arrow points towards the foot process fusion on the glomerular basement membrane. The green bar in the db/db image on the right side indicates the thickening of Glomerular basement membrane. (B) tSNE visualization of kidney cells from db/db and db/m mice, colored by cell type. DCT, distal convoluted tubule; PTS3, third segment of the proximal tubule; PTS2, second segment of the proximal tubule; PTB, proximal tubule brush; CD, collecting duct; LOH, loop of Henle; PTS1, first segment of the proximal tubule; B cell, B lymphocytes; M1, classical macrophage; T cell, T lymphocyte; M2, alternatively activated macrophage; Endo, endothelial cells; Neut, neutrophil progenitor; Podo, podocyte; NK, natural killer cell. (C) Bar plot showing the percentages of transcriptionally defined cell populations in db/db and db/m mice. The colors correspond to the cell types identified. (D) Heatmap of the mean expression of two manually selected marker genes in each cell type. Gene expression was standardized between –3 and 3 and is indicated by color intensity.