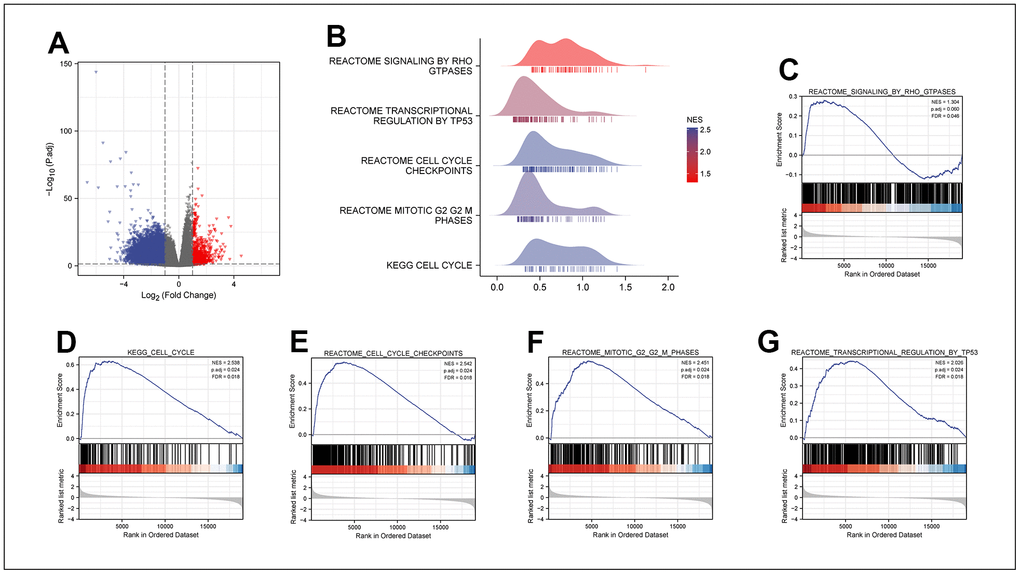
Figure 5.DEGs between MRPL13 high and low expression groups in LUAD. (A) The volcano map of DEGs (red: upregulation; blue: downregulation). (B) GSEA enrichment analysis results of high and low MRPL13 differential genes visualized in Ridgeline plot. (C–G) GO and KEGG analyses for samples with high and low MAZ expression in LUAD.