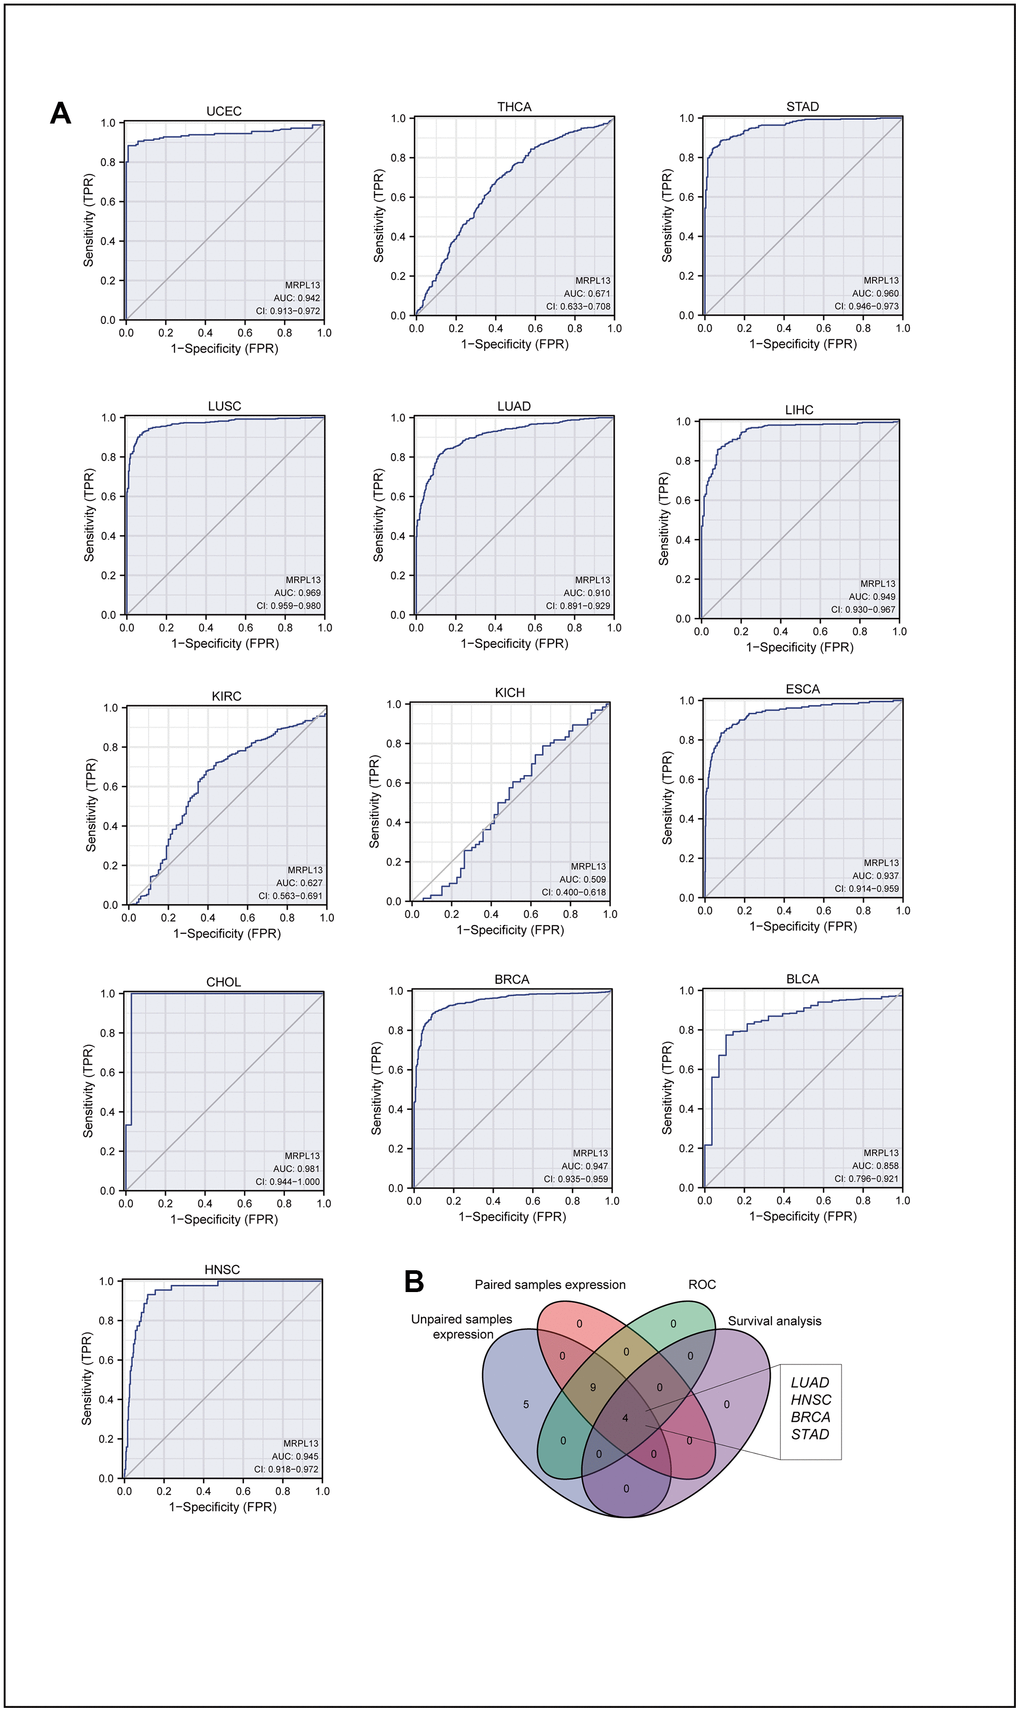
Figure 2.AUC of ROC curves verified the diagnosis performance of MRPL13 in the TCGA cohort. (A) ROC curve shows the value of MRPL13 in the diagnosis of patients with Pan-cancer, including UCEC, THCA, STAD, LUSC, LUAD, LIHC, KIRC, KICH, ESCA, CHOL, BRCA, BLCA, HNSC. (B) Venn diagram showed the intersection of cancer in pan-cancer, which was significant in expression, diagnostic performance and prognosis analysis.