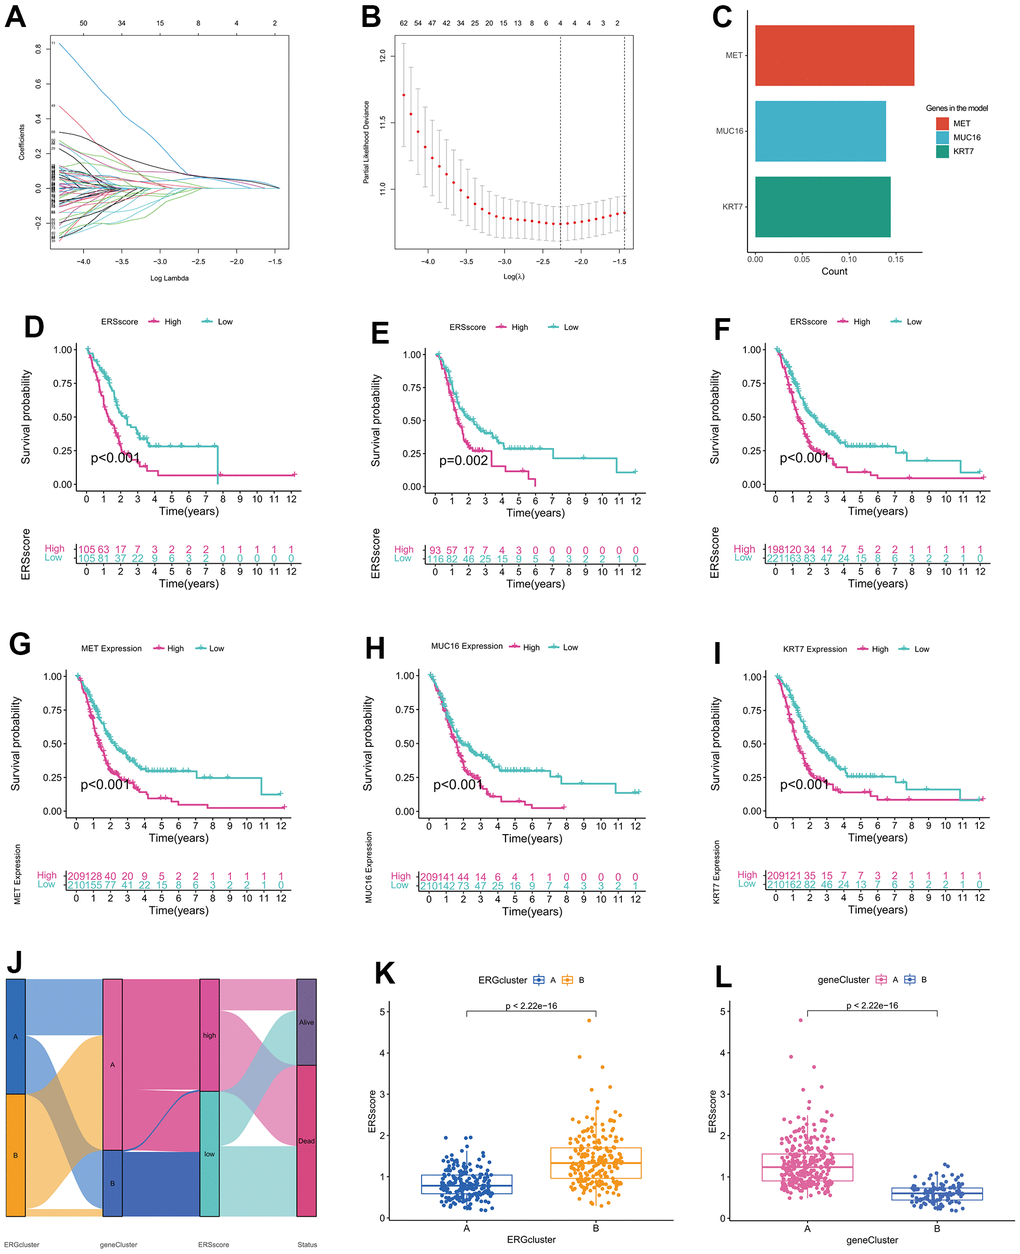
Figure 5.Establishment of endoplasmic reticulum stress-related prognostic model. (A) Coefficient path diagram for LASSO regression. (B) The cross-validation curve. (C) Coefficients of MET, MUC16, and KRT7 in the model. Survival curve of the training cohort (D), validation cohort (E), and whole cohort (F). Survival curve between high-expression and low-expression groups of MET (G), MUC16 (H), and KRT7 (I). (J) Alluvial diagram of changes in ERGclusters, geneClusters, ERS score and survival state. (K) The difference of ERS score between ERGcluster A and B. (L) The difference of ERS score between geneCluster A and B.