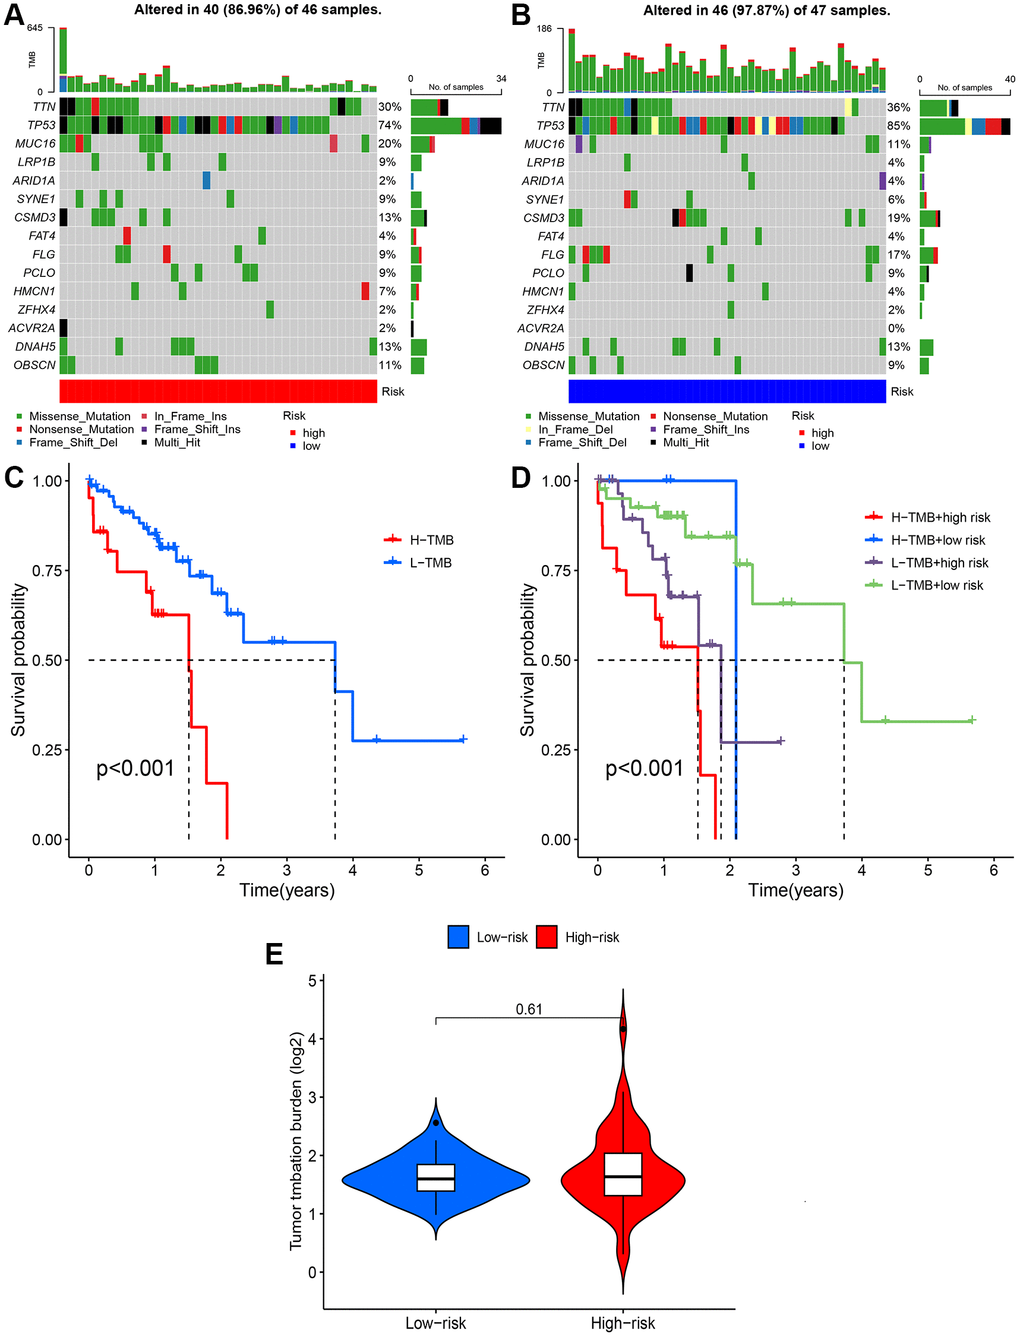
Figure 8.Tumor mutation burden (TMB) analysis. (A, B) Waterfall plots of somatic mutation characteristics in the two groups. (C) Kaplan-Meier survival curves between the high- and low-TMB groups. (D) Kaplan-Meier survival curves between the four groups. (E) TMB between the low-risk and high-risk groups.