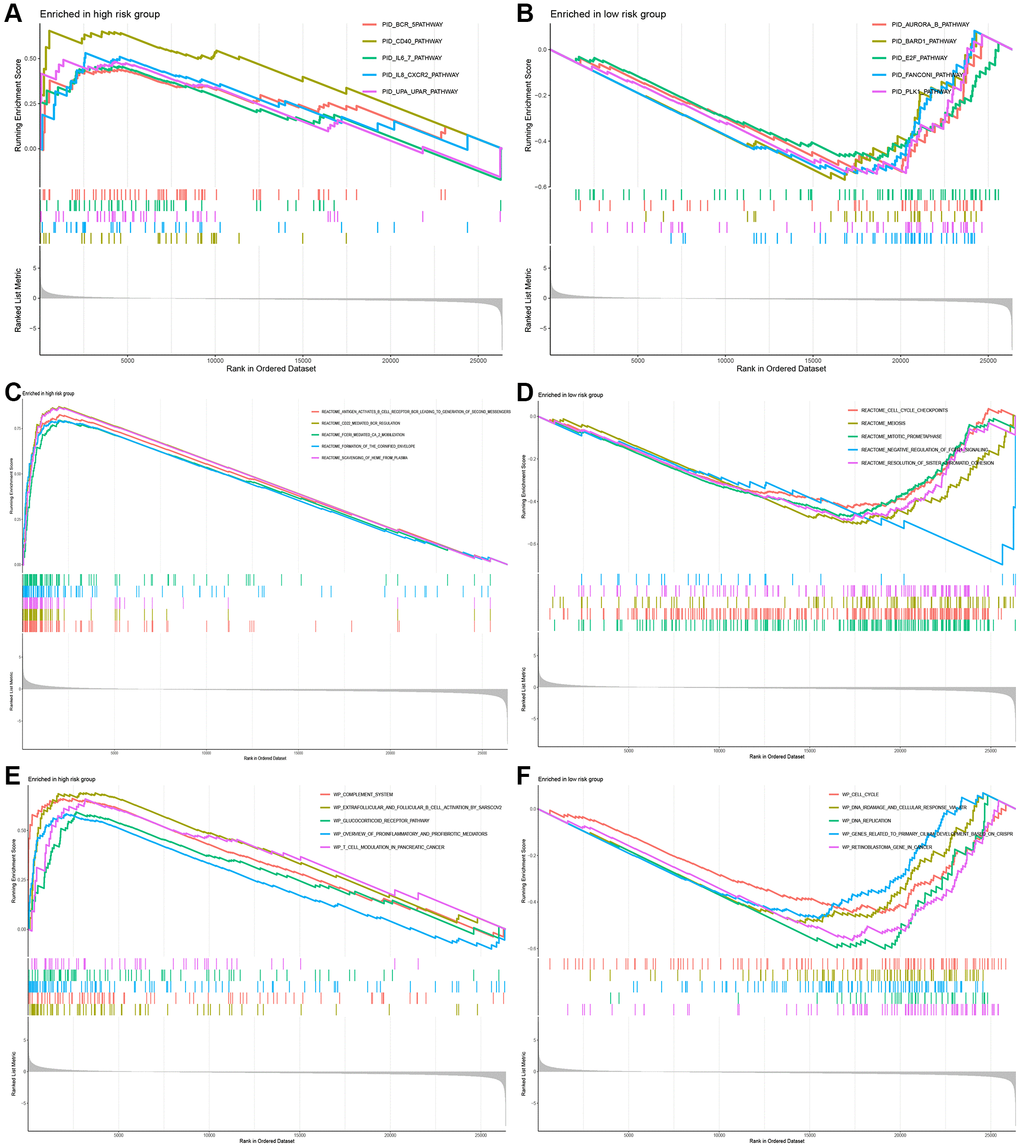
Figure 7.Functional analysis between the high-risk and low-risk groups. (A, B) The pathways of PID enriched in the low- and high-risk group. (C, D) The pathways of REACTOME enriched in the low- and high-risk group. (E, F) The pathways of WP enriched in the low- and high-risk group.