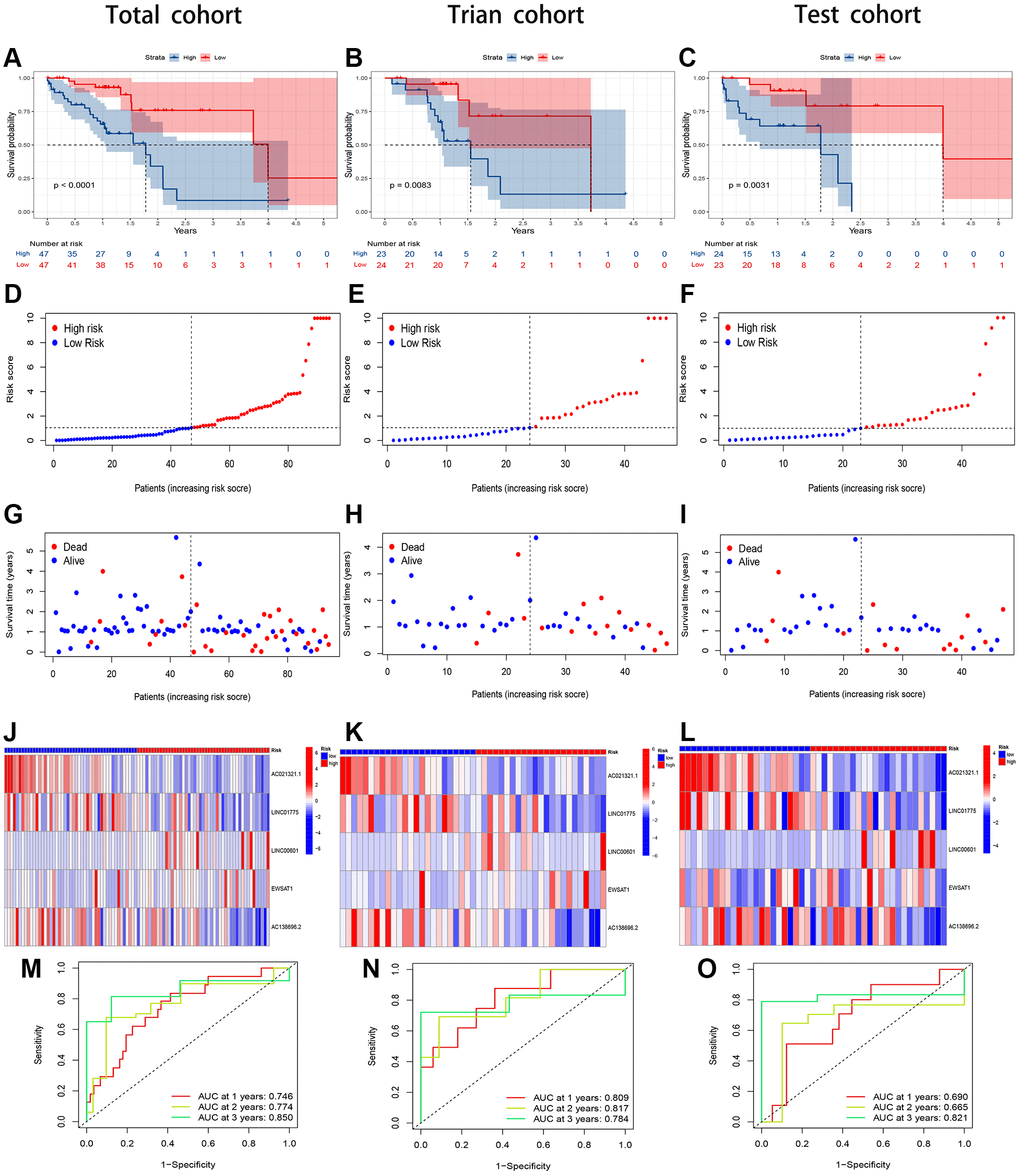
Figure 4.Evaluation of the CuRLs prognostic signature in the total, training and test cohorts. (A–C) Overall survival Kaplan-Meier survival curves. (D–F) Overall survival risk score. (G–I) Distribution of survival time and survival status. (J–L) Heatmap of 5 lncRNA expressions. (M–O) 1-, 2-, and 3-years overall survival area under the ROC curve of the signature.