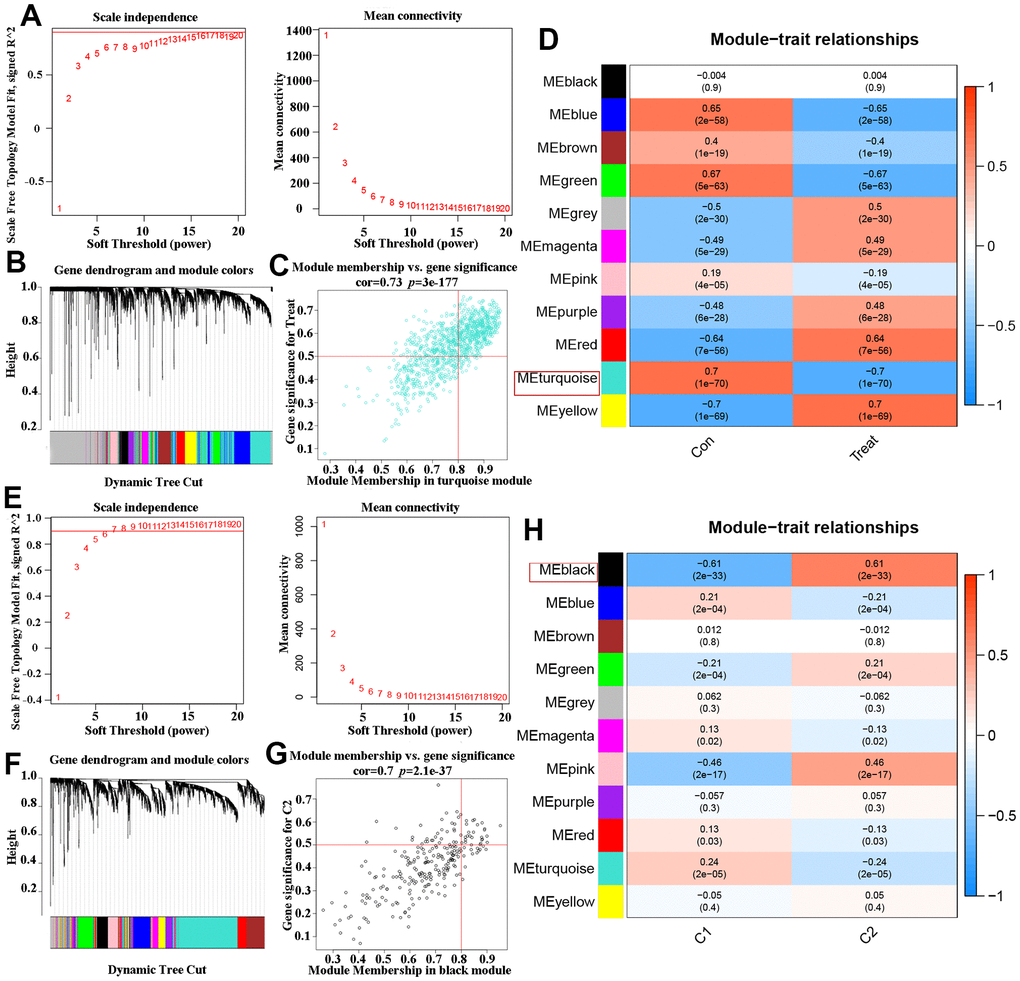
Figure 5.Co-expression network of DEGs in AD and two DEOSGs clusters. (A) The detection of soft threshold power in AD. (B) Cluster tree dendrogram of co-expression modules in AD patients. (C) Scatter plot in ME turquoise module and the DEGs significance for AD. (D) Heatmap of association of module feature genes with several clinical states. (E) The detection of soft threshold power in two DEOSGs clusters. (F) Cluster tree dendrogram of co-expression modules in the two DEOSGs clusters. (G) Scatter plot ME black module and the DEGs significance for the two DEOSGs clusters. (H) Correlation heatmap between two DEOSGs clusters.