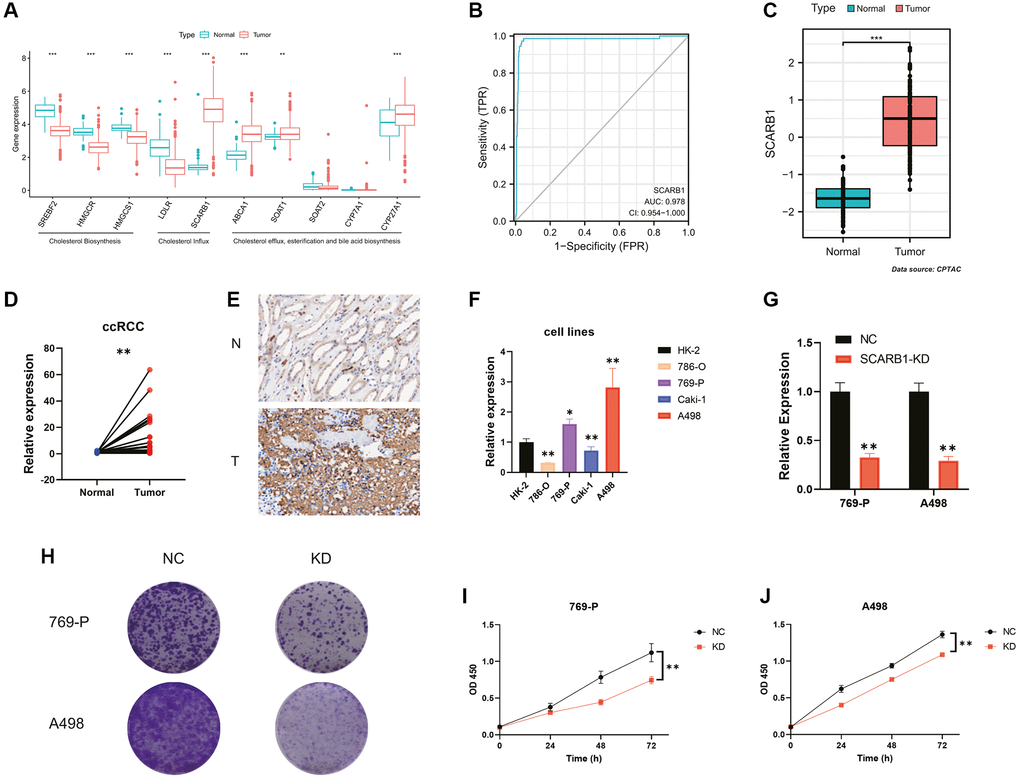
Figure 6.Screening and validation of the effects of SCARB1 in ccRCC. (A) Differential mRNA expression analysis of 10 CMGs between ccRCC and normal kidney tissues. (B) The AUC for SCARB1 in ccRCC cases was 0.9597. (C) Differential protein expression analysis of SCARB1 between ccRCC and adjacent cancerous tissues. (D) Comparison of mRNA expression levels of SCARB1 between ccRCC and adjacent cancerous tissues; n = 30. (E) IHC staining of SCARB1 in clinical ccRCC and adjacent cancerous tissues; N: adjacent cancerous tissue; T: ccRCC tissues. (F) Comparison of mRNA expression levels of SCARB1 in HK-2 and RCC cell lines by RT-qPCR; n = 3. (G) The knockdown efficiency of si-SCARB1 was verified by evaluating SCARB1 mRNA expression using RT-qPCR; n = 3. (H) Comparison of the clone formation ability between negative control groups and SCARB1 knockdown groups in 769-P and A498 cells. Abbreviations: NC: negative control; KD: knockdown; OD: optical density. (I, J) Cell proliferation curve following transfection of si-SCARB1 in (I) 769-P and (J) A498 cells. *p-value < 0.05, **p-value < 0.01, ***p-value < 0.001.