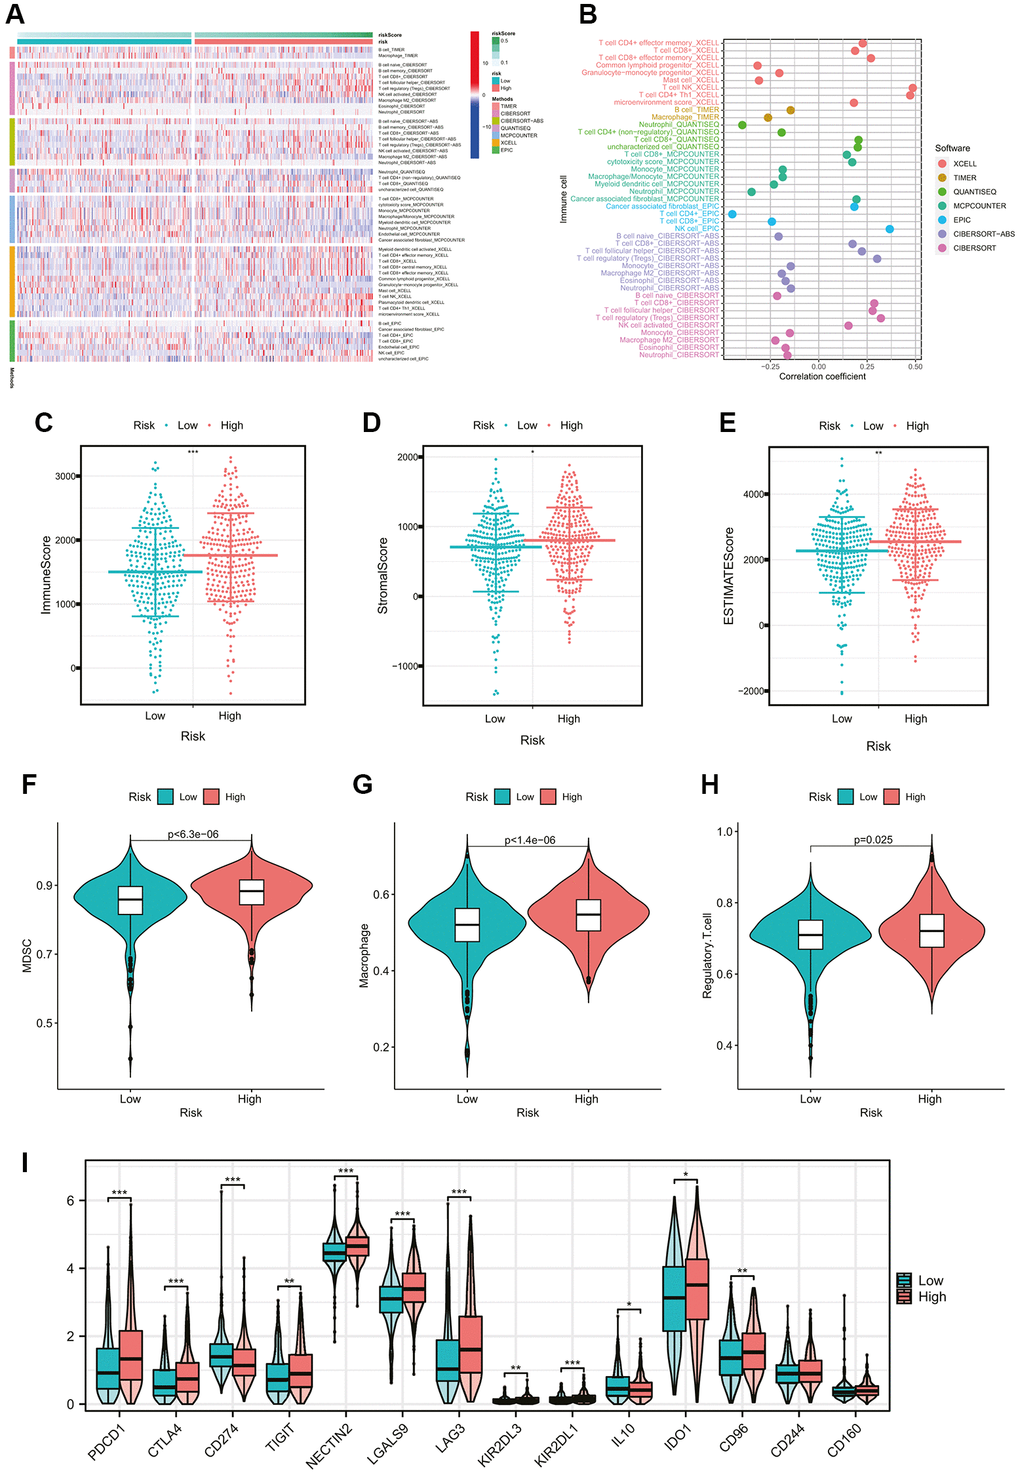
Figure 5.Comparison of immune cells and immune functions of ccRCC patients between risk groups. (A) The heatmap showing the tumor-infiltrating immune cells and risk scores by 7 mainstream algorithms. (B) The lollipop plot showing the correlation coefficients of tumor-infiltrating immune cells with CMGs-based risk scores. (C–E) Differential analysis of immune-related scores between risk groups based on the ESTIMATE algorithm. (F–H) Differential abundance analysis of major immunosuppressive infiltrating cells (MDSCs, macrophages, and Tregs) between risk groups based on the ssGSEA algorithm. (I) Differential expression analysis of the common immune checkpoint molecules between risk groups (PDCD1, p < 0.001; CTLA-4, p < 0.001; CD96, p < 0.001). *p-value < 0.05, **p-value < 0.01, ***p-value < 0.001.