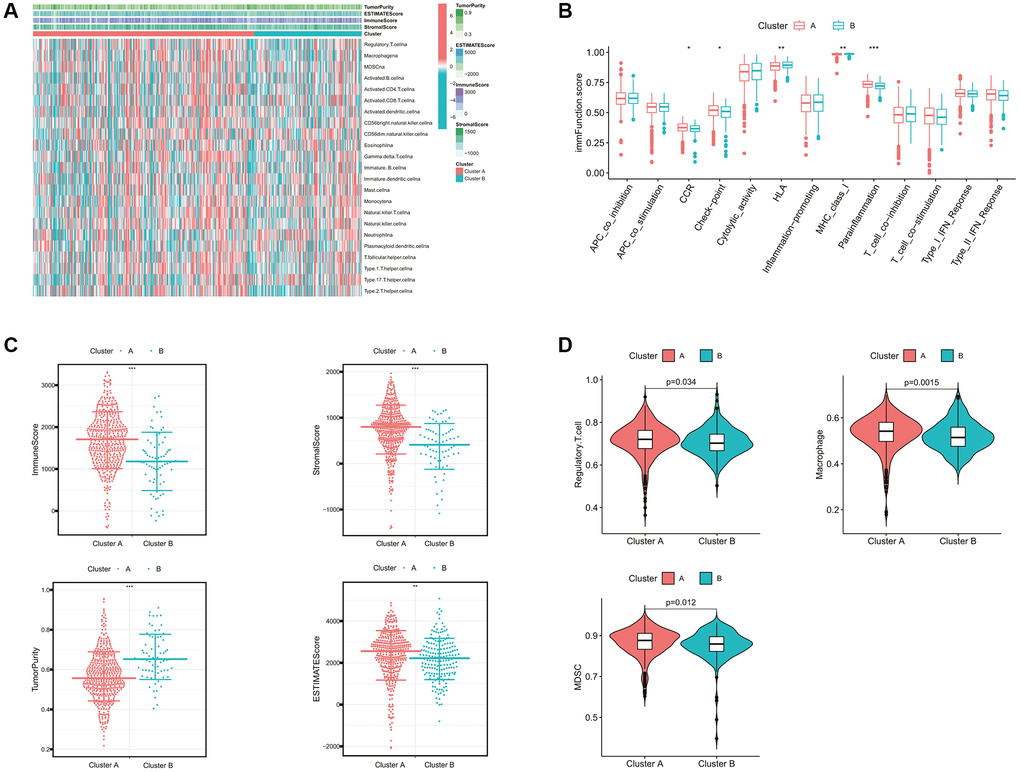
Figure 3.Comparison of the immune characteristics between cholesterol metabolic subtypes. (A) The heatmap showing the immune-related scores and immune cell infiltration levels of ccRCC samples. (B) Differential immune function analysis between cholesterol metabolic subtypes. (C) Differential analysis of immune-related scores between cholesterol metabolic subtypes based on the ESTIMATE algorithm. (D) Differential abundance analysis of major immunosuppressive cells between cholesterol metabolic subtypes based on the ssGSEA algorithm. *p-value < 0.05, **p-value < 0.01, ***p-value < 0.001.