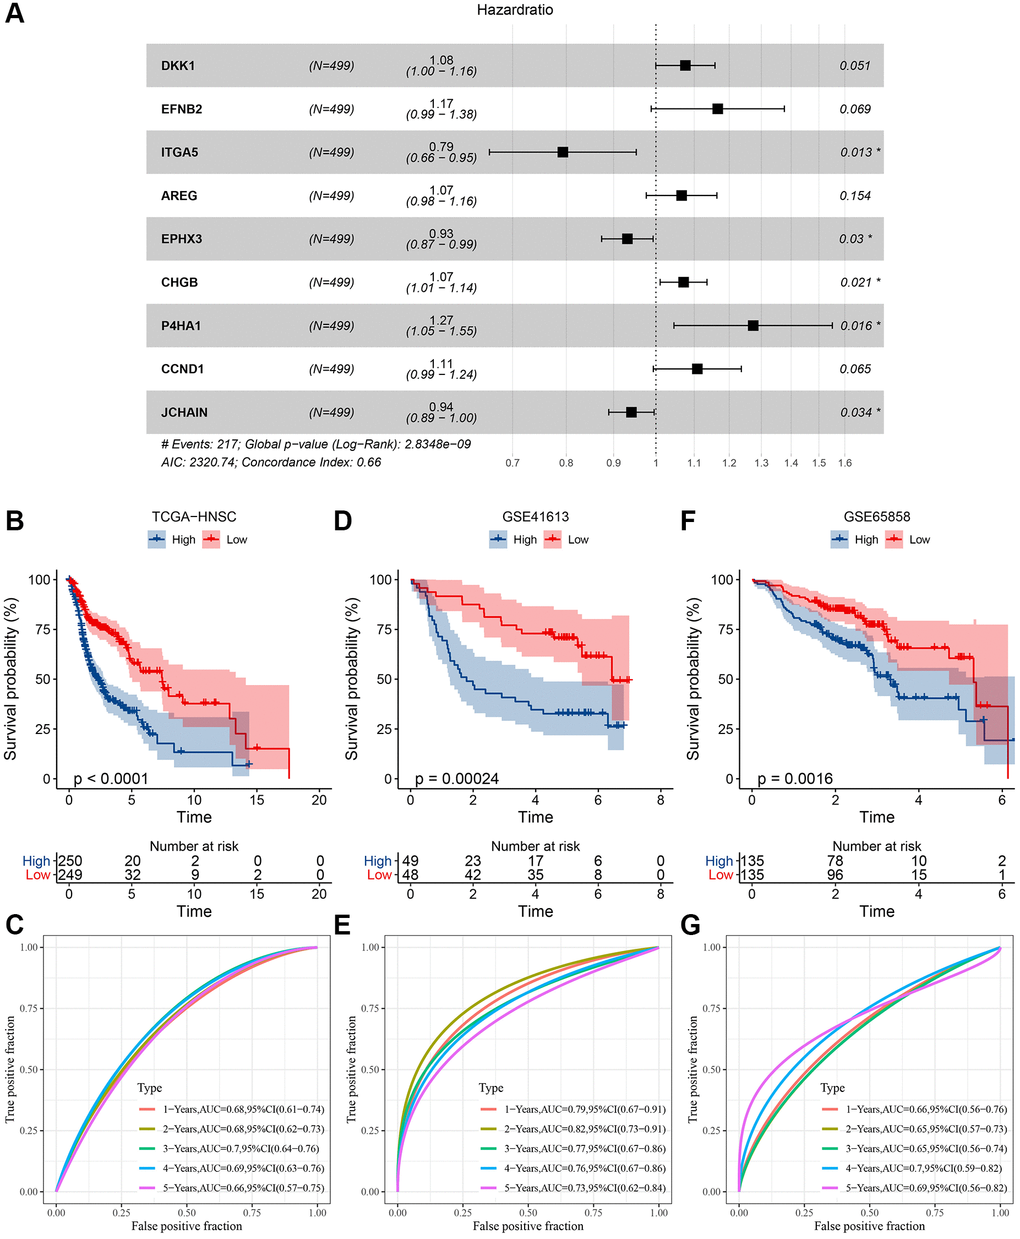
Figure 6.Determination of risk model and its KM, ROC curves. (A) Multifactor forest plot of prognostic key genes; (B) KM curve of risk model constructed for 9 genes in TCGA dataset; (C) ROC curve of the risk model in TCGA dataset; (D) KM curve of risk model constructed for 9 genes in GSE41613 dataset; (E) ROC curve of risk model in GSE41613 dataset; (F) KM curve of risk model constructed for 9 genes in GSE65858 dataset; (G) ROC curve of risk model in GSE65858 dataset.