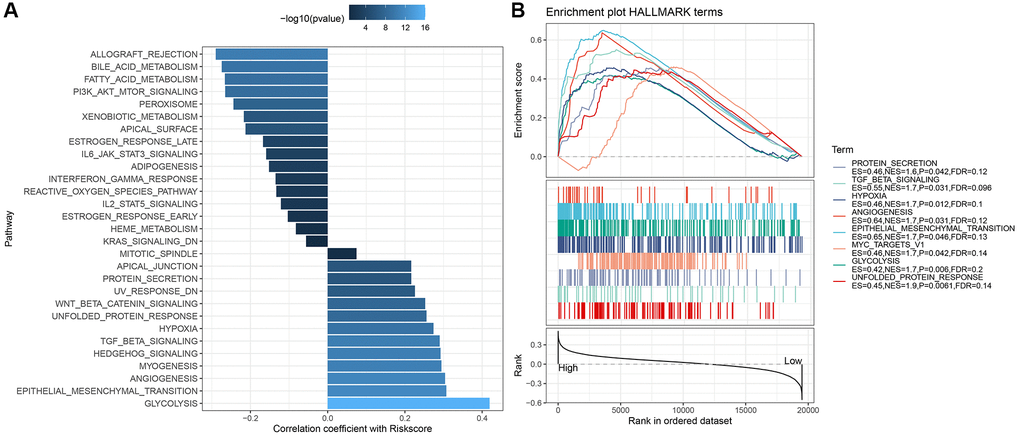
Figure 10.Correlation between differential pathways and RiskScore in risk groups and their GSEA results in TCGA dataset. (A) Correlation between risk intergroup differential pathways and RiskScore in TCGA dataset; (B) GSEA results for high- and low-risk groups in TCGA dataset.