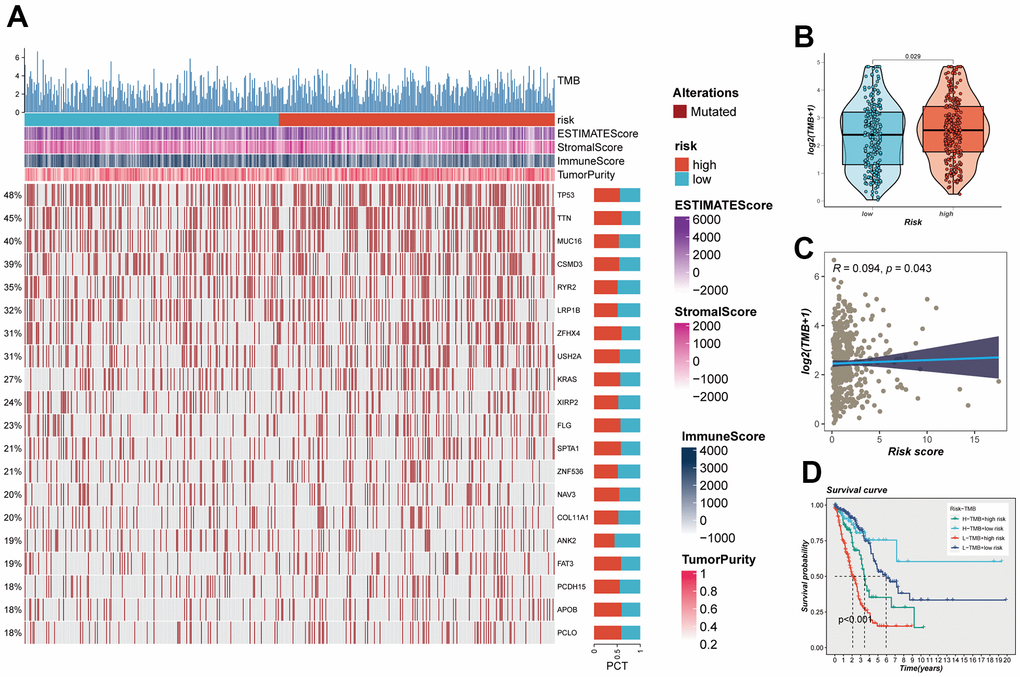
Figure 9.Mutation analysis. (A) Mutation landscape of the top 20 genes with mutation frequency in the high-low risk group. (B) TMB differences between high- and low-risk patients. (C) Relationship between risk score and tumor mutation burden. (D) Survival analysis between four different groups (High-TMB+High-Risk, High-TMB+Low-Risk, Low-TMB+High-risk, and Low-TMB+low-risk).