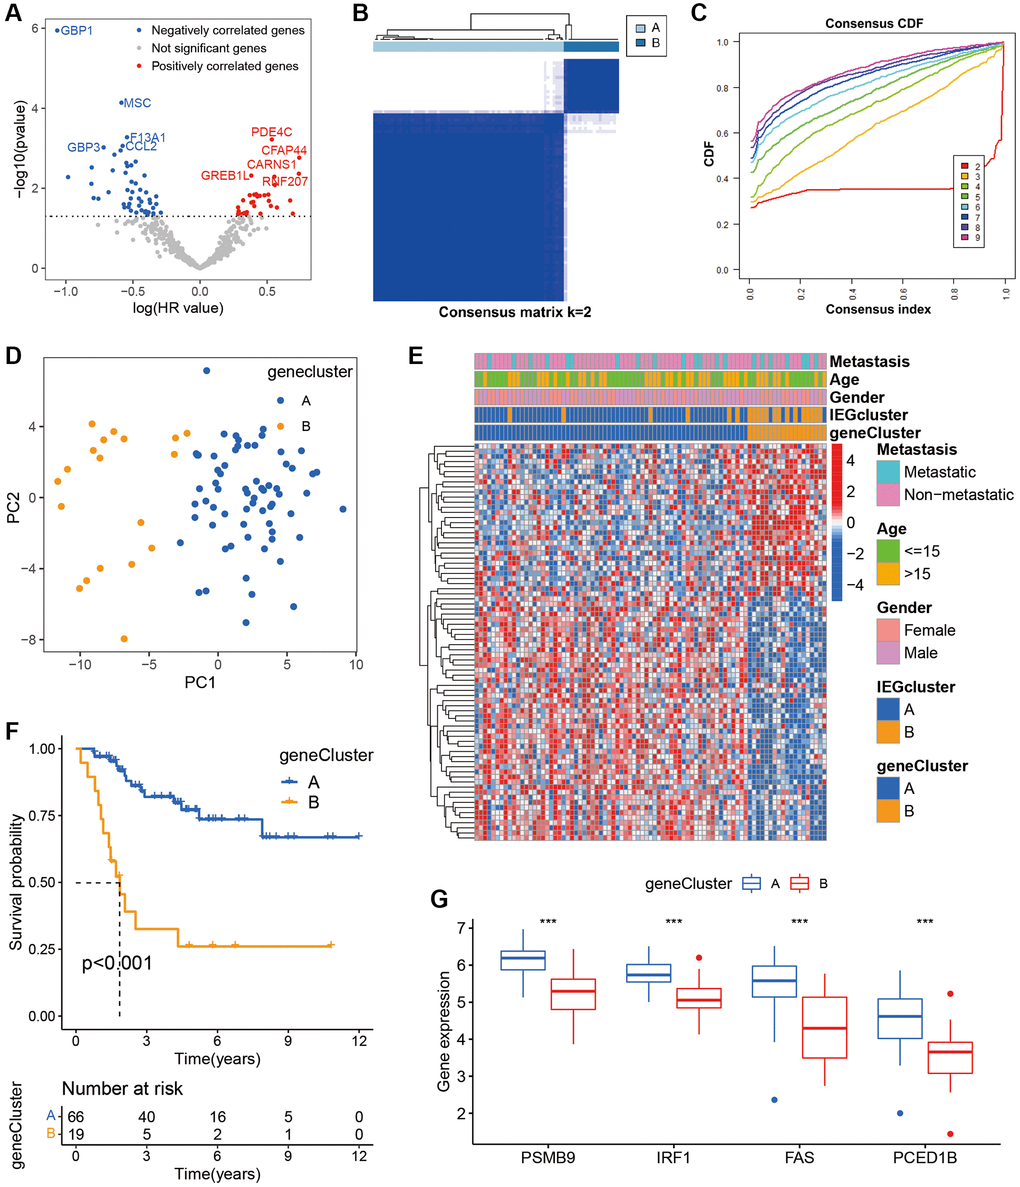
Figure 3.Identification of gene clusters based on prognostic DEGs. (A) Volcano plot displaying univariate Cox regression results of the 502 DEGs. (B) The consensus score matrix. (C) The CDF curve for k = 2–9. (D) PCA of the two gene clusters. (E) Heatmap of clinical characteristics of the two gene clusters according to the expression of prognostic DEGs. (F) Kaplan-Meier survival analysis of the two gene clusters. (G) The box plot shows genes that are significantly differentially expressed in two gene clusters.