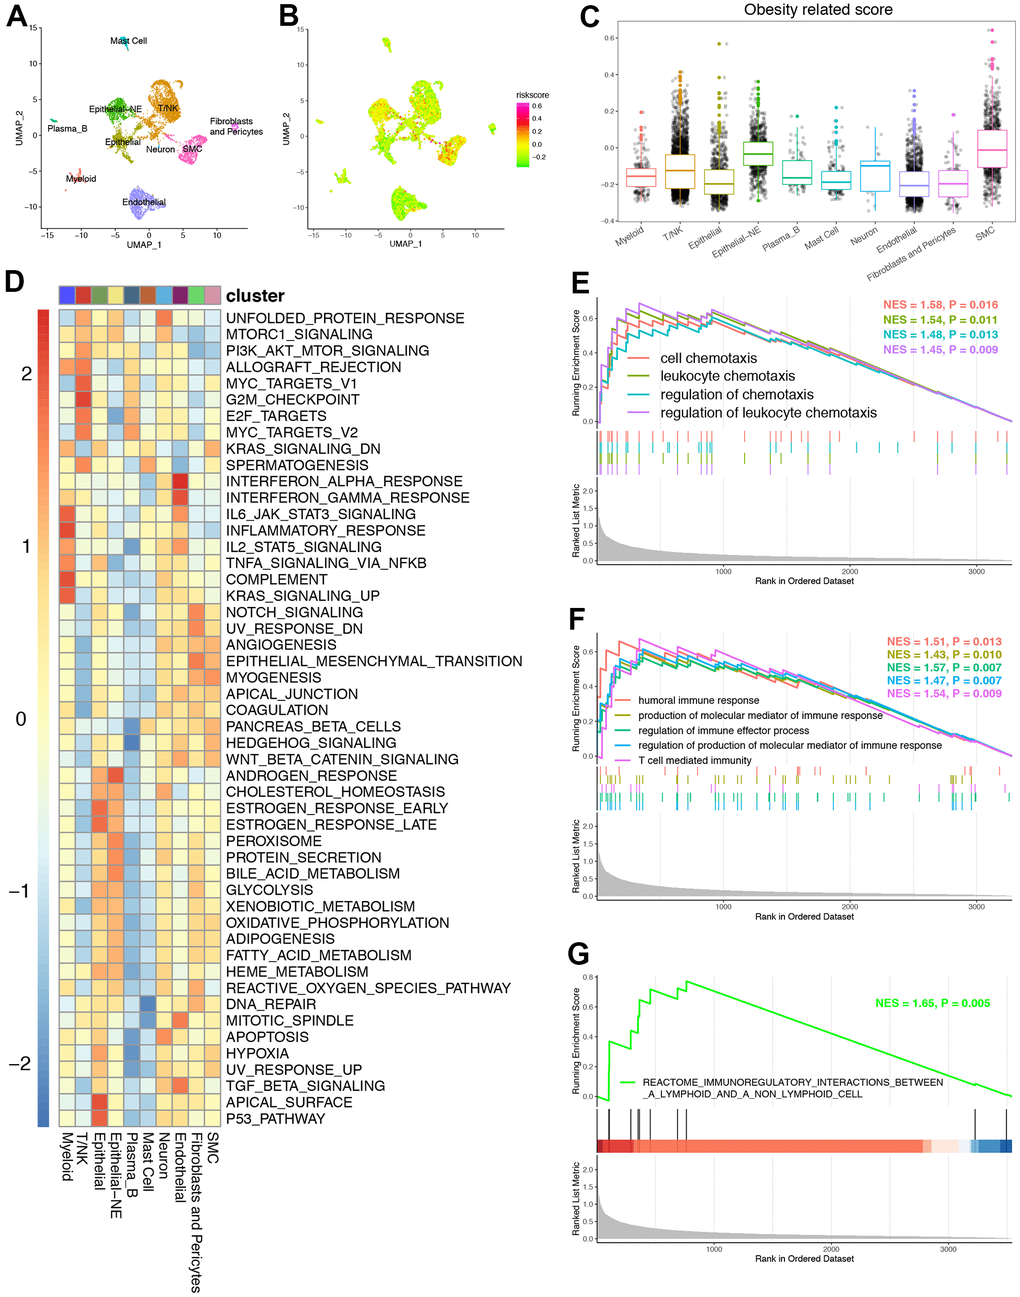
Figure 7.The role of ORGs signature on the single cell level. (A) UMAP plots of GSE157703 and each cluster were visualized and marked by different cell types. (B) Distribution of ORGs signature on the single cell level. (C) The expression of ORGs on the single cell level. (D) The heatmap revealed that significant connection probability of ORGs related signaling pathways on single cell level. (E) Gene ontology (GO) enrichment of chemokine related signatures identified by gene set enrichment analysis (GSEA) on the single cell level. (F) Gene ontology (GO) enrichment of T cell activation related signatures identified by gene set enrichment analysis (GSEA) on the single cell level. (G) Kyoto Encyclopedia of Genes and Genomes (KEGG) enrichment of T cell activation related signature identified by GSEA on the single cell level.