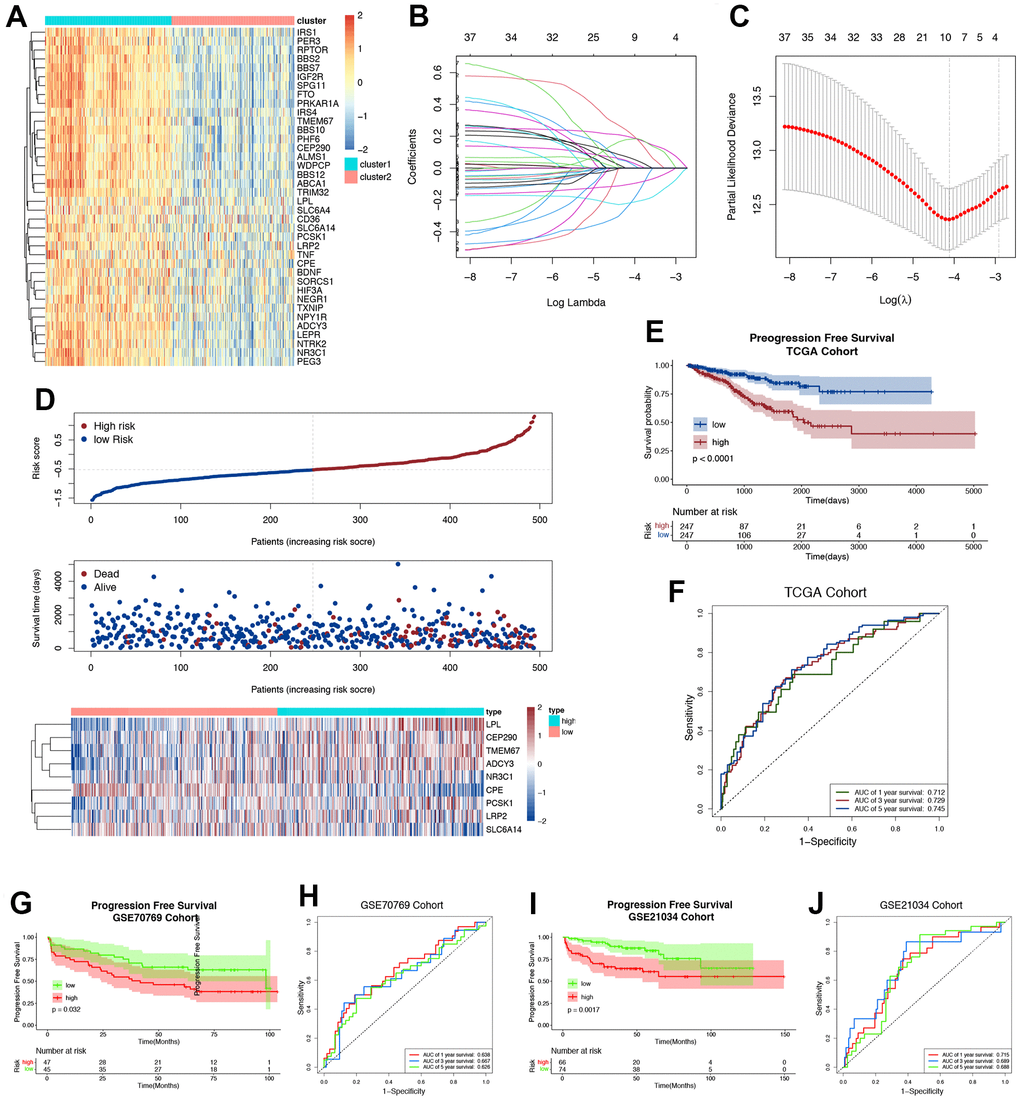
Figure 3.Construction and validation of ORGs risk score. (A) The expression levels of ORGs in two clusters. The darker color indicates a higher expression, where up-regulated genes were marked as red, and down-regulated genes were marked as blue. (B) LASSO regression of the ORGs possessing prognostic value. (C) Cross-validation for turning parameter selection via minimum criteria LASSO regression model. (D) Distribution of risk score, survival status and the expression of nine prognostic ORGs in PRAD. (E) Progression free survival (PFS) for PRAD patients in high-/low-risk group. (F) The ROC curve of measuring the predictive value. (G) The Kaplan-Meier survival plot of each patient in GSE70769 cohort. (H) The time-dependent ROC curves of ORGs risk score in GSE70769 cohort. (I) The Kaplan-Meier survival plot of each patient in GSE21034 cohort. (J) The time-dependent ROC curves of ORGs risk score in GSE21034 cohort.