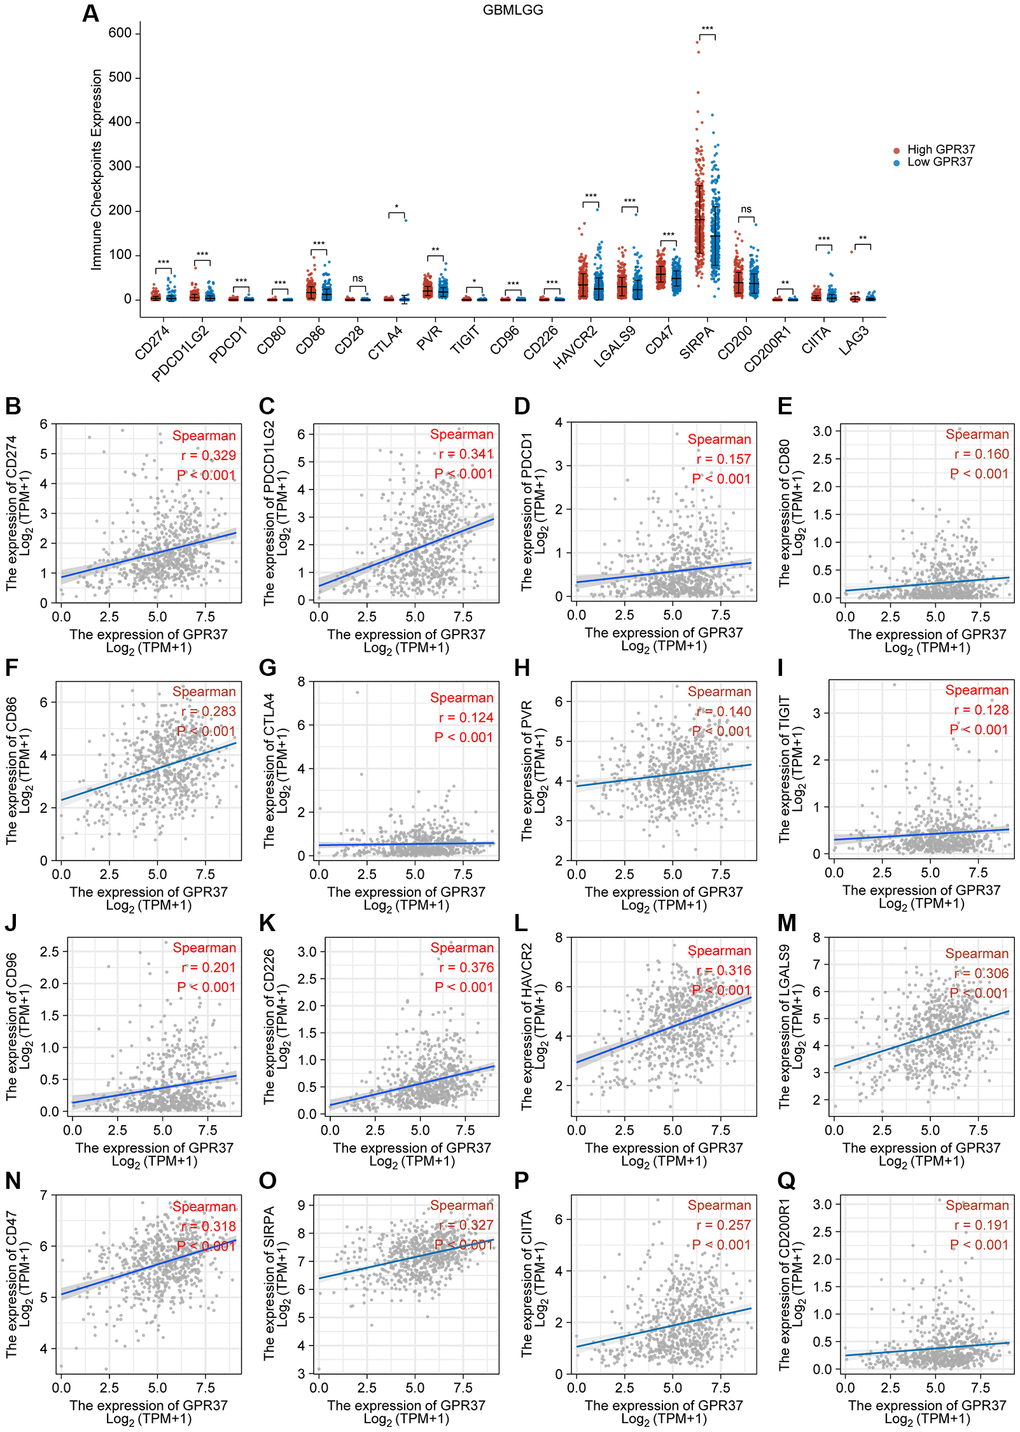
Figure 9.Correlation between GPR37 expression levels and common immune checkpoints (ICPs). (A) Graph showing expression of ICPs in the GPR37high (red) and GPR37low (blue) groups. (B–Q) Spearman correlation coefficients for the association between the expression levels of GPR37 and ICPs. *P < 0.05, **P < 0.01, ***P < 0.001.