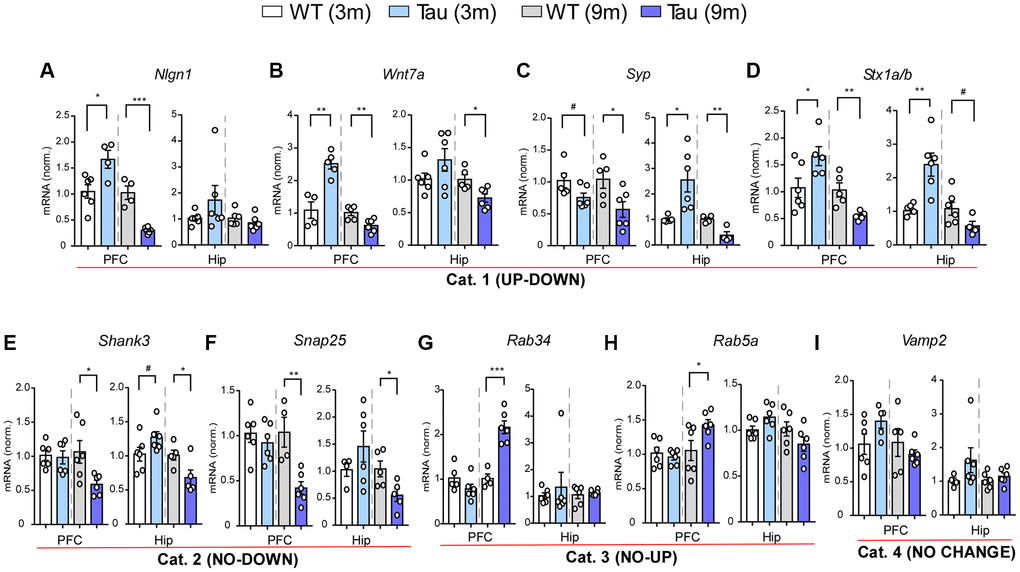
Figure 5.Gene expression profiling revealed various patterns of changes in PFC and hippocampus of P301S mice at different ages. (A–I) Bar graphs of mRNA levels in PFC and hippocampus of WT and P301S mice at 3 and 9 months (n: WT/Tau = 6/6 per group), which included: Category 1 (UP-DOWN) (A–D, Nlgn1, Wnt7a, Syp, Stx1b); Category 2 (NO-DOWN) (E, F, Shank3, Snap25); Category 3 (NO-UP) (G, H, Rab34, Rab5a); and Category 4 (NO CHANGE) (I, Vamp2). #p < 0.1, *p < 0.05, **p < 0.01, ***p < 0.001, t-test.