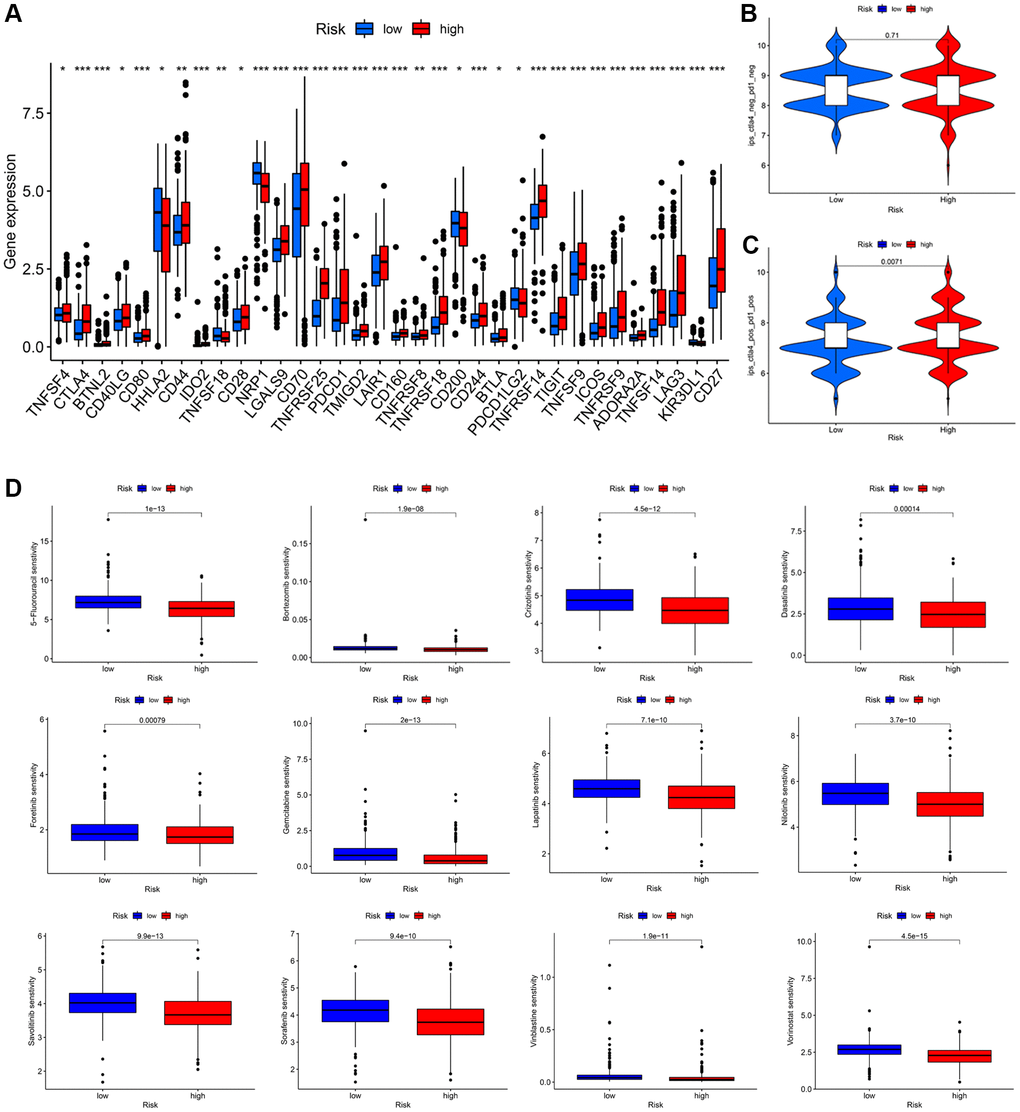
Figure 9.Immunotherapeutic response prediction and drug susceptibility analysis between low- and high-risk groups in KIRC patients. (A) Differential expression of common immune checkpoints. (B, C) Relative response of anti-PD1 and anti-CTLA4 therapy. (D) Difference analysis of anti-tumor drug sensitivity.