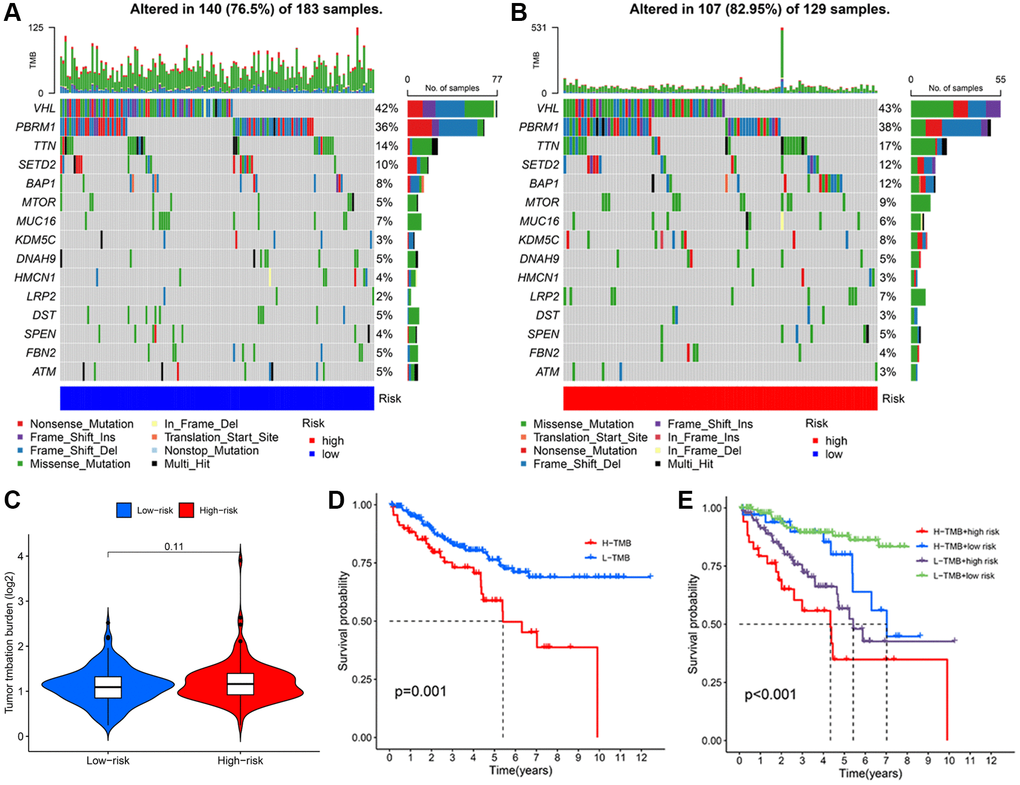
Figure 8.Analysis of TMB based on TRLs prognostic signature in KIRC patients. The waterfall plot illustrates the type and frequency of tumor mutational burden in the low-risk group (A) and high-risk group (B). (C) TMB levels between two groups. (D) The Kaplan-Meier curve of KIRC patients in the low- and high-TMB groups. (E) The Kaplan-Meier curves of KIRC patients among diverse subgroups based on the risk score and TMB levels.