Submit an Article
Navigate
Home
Editorial Board
Editorial Policies
Current Volume
Archive
Scientific Integrity
Publication Ethics Statements
Interviews with Outstanding Authors
Newsroom
Sponsored Conferences
Podcast
Contact
Special Collections
Submit an Article
Online ISSN: 1945-4589
Research Paper
|
Volume 15, Issue 20
|
pp. 11012–11032
A comprehensive prognostic and immunological analysis of telomere-related lncRNAs in kidney renal clear cell carcinoma
Back to article
Figure 4
(4 of 9)
−
100%
+
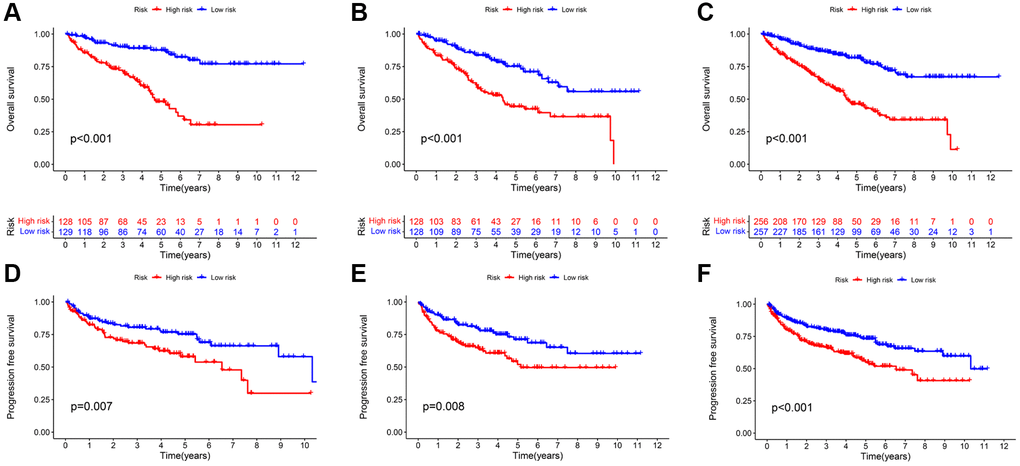
Figure 4.
Kaplan-Meier survival analysis based on TRLs prognostic signature.
The OS rates (
A
–
C
) and PFS rates (
D
–
F
) of different risk groups in the training; testing; and entire cohorts; respectively.