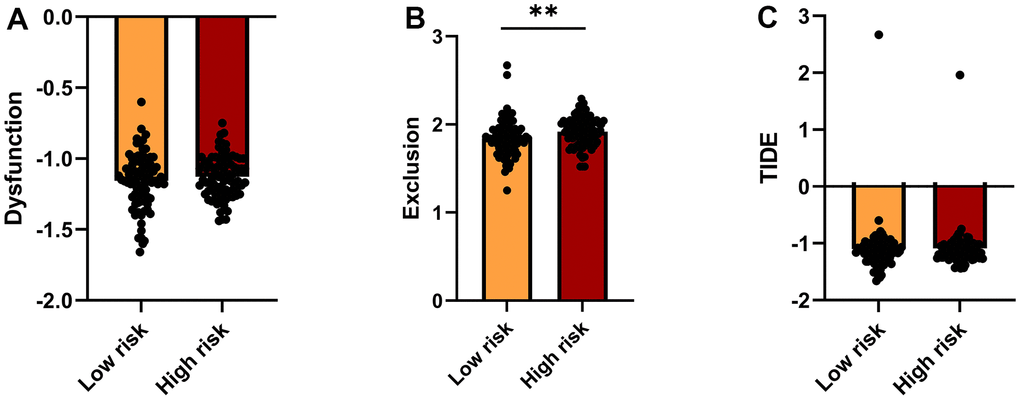
Figure 6.TIDE analysis of immunotherapy response. (A–C) TIDE-based Dysfunction scores (A), Exclusion scores (B), and overall TIDE scores (C) for the high- and low-risk groups.
Figure 6 — Prognosis and immunoinfiltration analysis of angiogene-related genes in grade 4 diffuse gliomas | Aging