Submit an Article
Navigate
Home
Editorial Board
Editorial Policies
Current Volume
Archive
Scientific Integrity
Publication Ethics Statements
Interviews with Outstanding Authors
Newsroom
Sponsored Conferences
Podcast
Contact
Special Collections
Submit an Article
Online ISSN: 1945-4589
Research Paper
|
Volume 15, Issue 18
|
pp. 9842–9857
Prognosis and immunoinfiltration analysis of angiogene-related genes in grade 4 diffuse gliomas
Back to article
Figure 5
(5 of 7)
−
100%
+
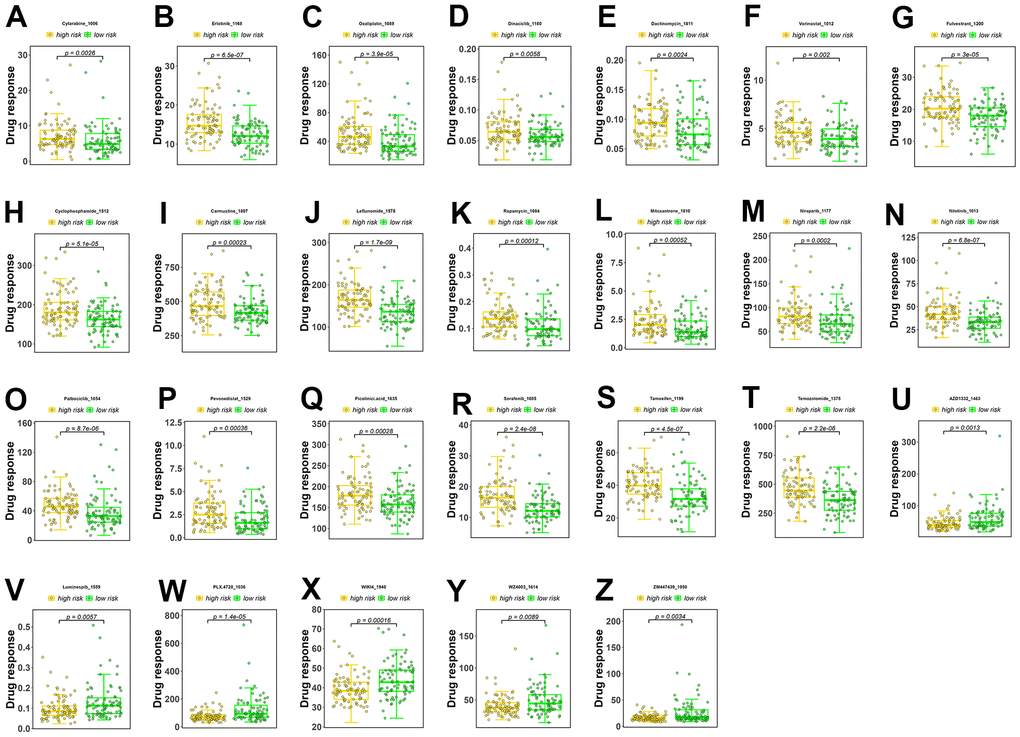
Figure 5.
Drug sensitivity analysis.
(
A
–
T
) Drugs with higher sensitivity in the low-risk group. (
U
–
Z
) Drugs with higher sensitivity in the high-risk group. The Y axis is IC50.