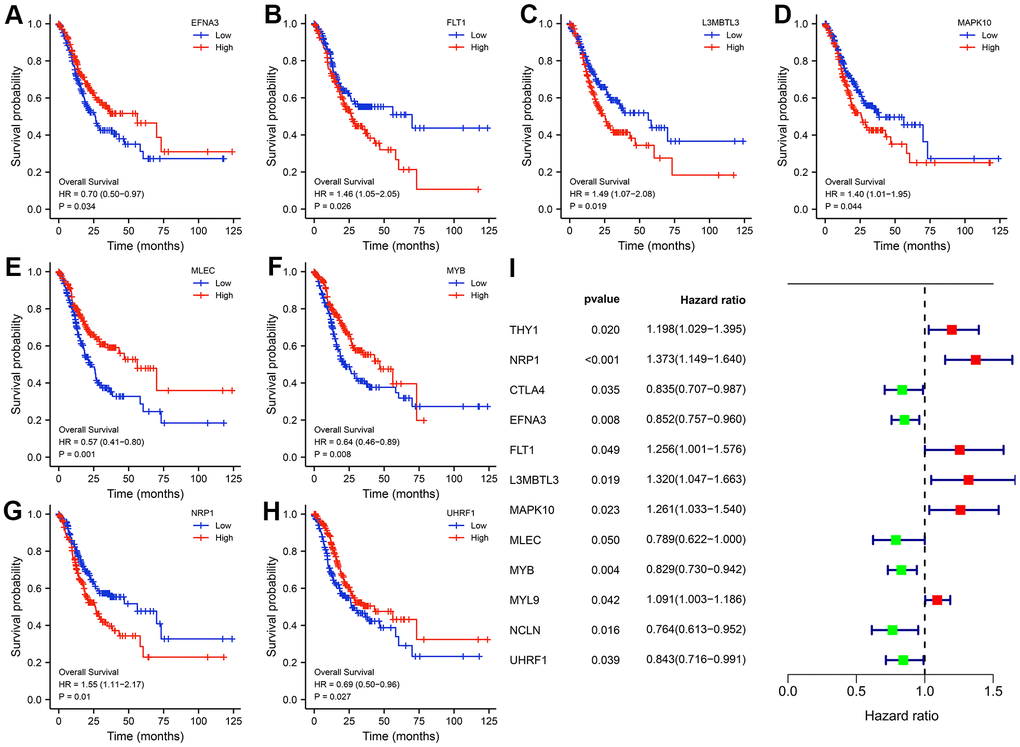
Figure 5.Kaplan-Meier (K-M) survival curves of the hub genes. (A) EFNA3. (B) FLT1. (C) L3MBTL3. (D) MAPK10. (E) MLEC. (F) MYB. (G) NRP1. (H) UHRF1. Univariate Cox regression analysis of the twelve hub genes. (I) Forest plot showing the prognostic values of hub genes.