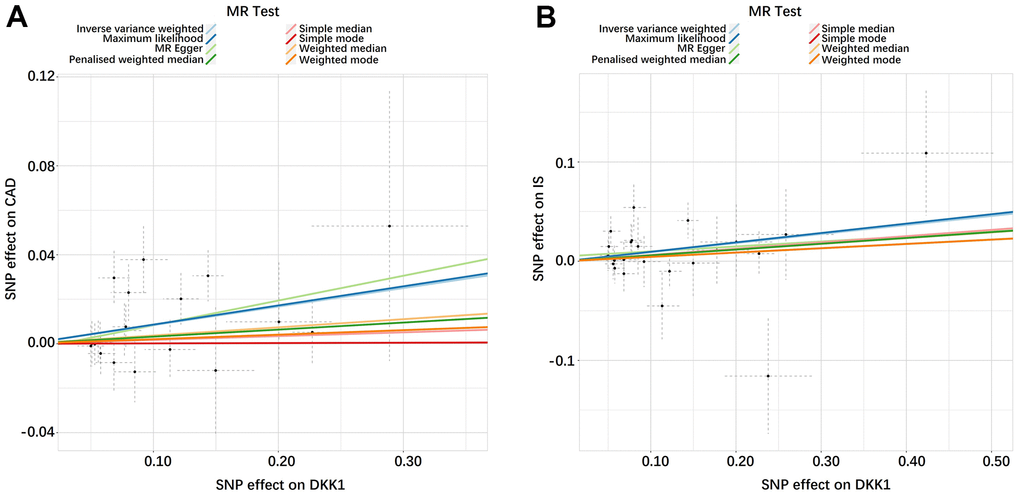
Figure 2.Scatter plots of the estimated SNP effects on DKK1 (x-axis) plotted against the estimated SNPs effects on CAD and IS (y-axis). (A) DKK1-CAD; (B) DKK1-IS. The slope of the line corresponds to a causal estimate using a different method. DKK1, Dickkopf-related protein 1; CAD, coronary artery disease; IS, ischemic stroke.