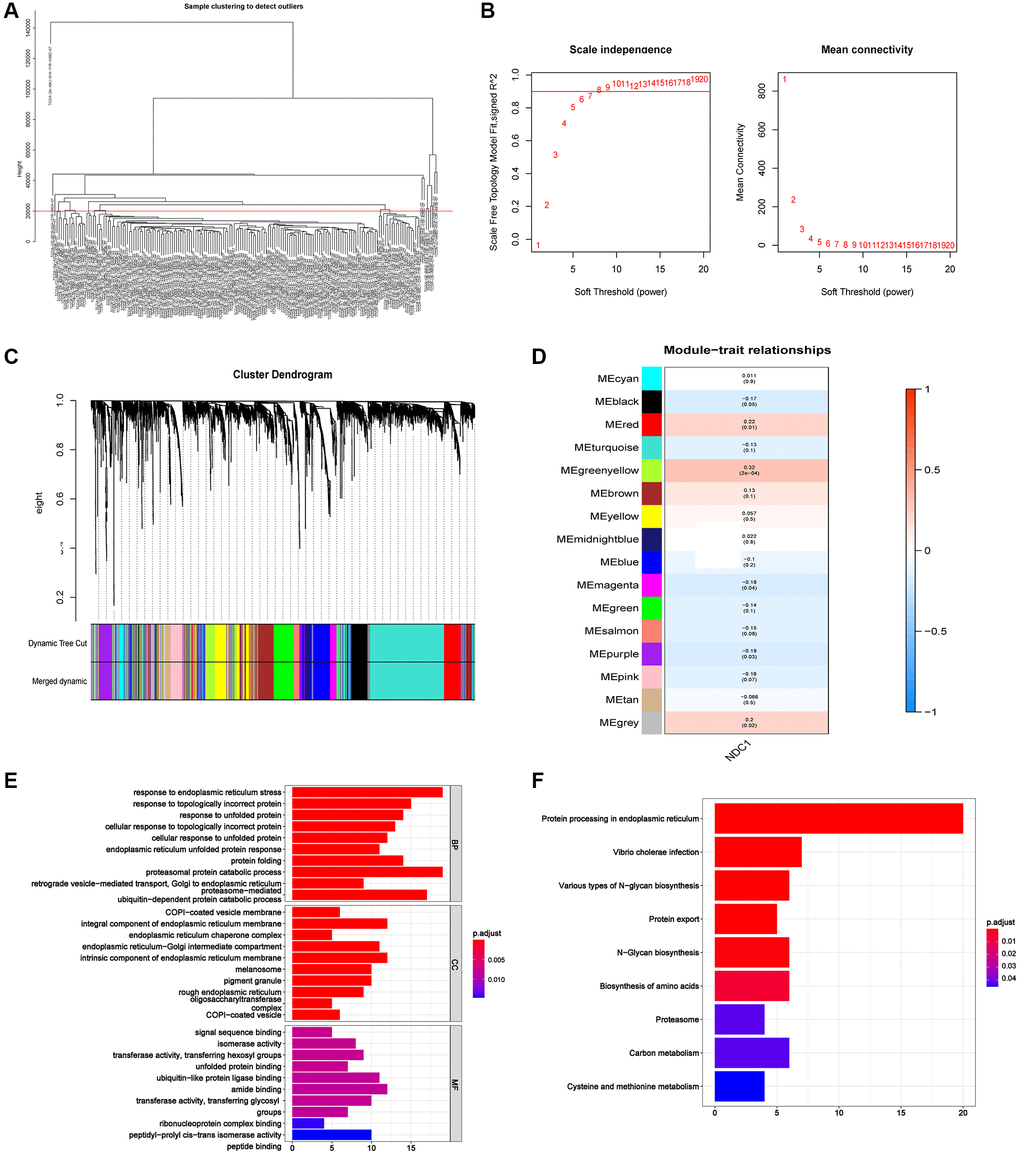
Figure 9.(A) The sample clustering dendrogram. (B) Determination of soft-threshold power. (C) Dendrogram of all differentially expressed genes clustered based on the measurement of dissimilarity. The color band shows the results obtained from the automatic single-block analysis. (D) Module-trait correlation in PAAD. The upper number is the correlation coefficient and the lower number in bracket is the p value. (E) The most enriched GO terms of the genes in MEgreenyellow module. (F) The most enriched KEGG pathways of the genes in MEgreenyellow module.