Submit an Article
Navigate
Home
Editorial Board
Editorial Policies
Current Volume
Archive
Scientific Integrity
Publication Ethics Statements
Interviews with Outstanding Authors
Newsroom
Sponsored Conferences
Podcast
Contact
Special Collections
Submit an Article
Online ISSN: 1945-4589
Research Paper
|
Volume 15, Issue 18
|
pp. 9779–9796
Pan-cancer analysis and experimental validation identify ndc1 as a potential immunological, prognostic and therapeutic biomarker in pancreatic cancer
Back to article
Figure 6
(6 of 11)
−
100%
+
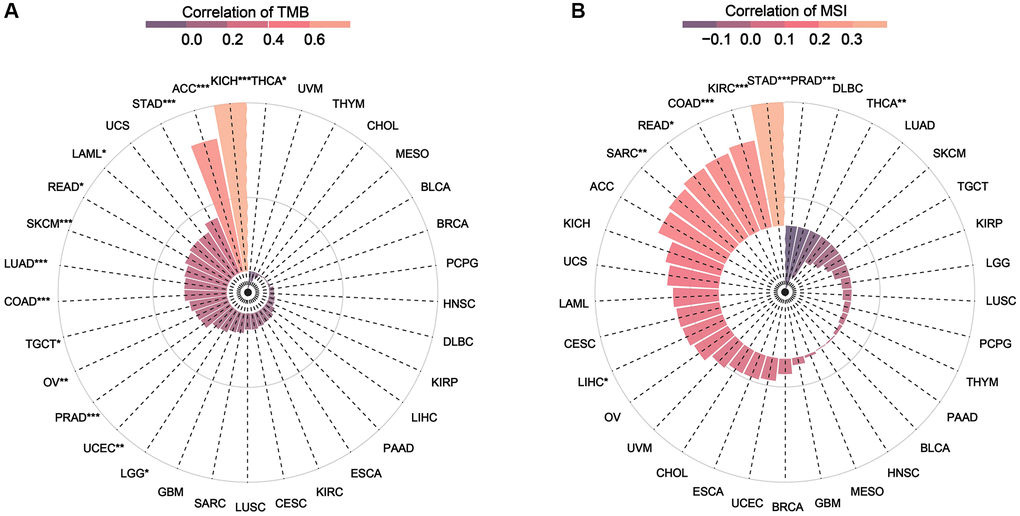
Figure 6.
(
A
) Relationship between TMB and NDC1 expression in pan-cancer. (
B
) Relationship between MSI and NDC1 expression in pan-cancer. The correlation increases from purple to pink.