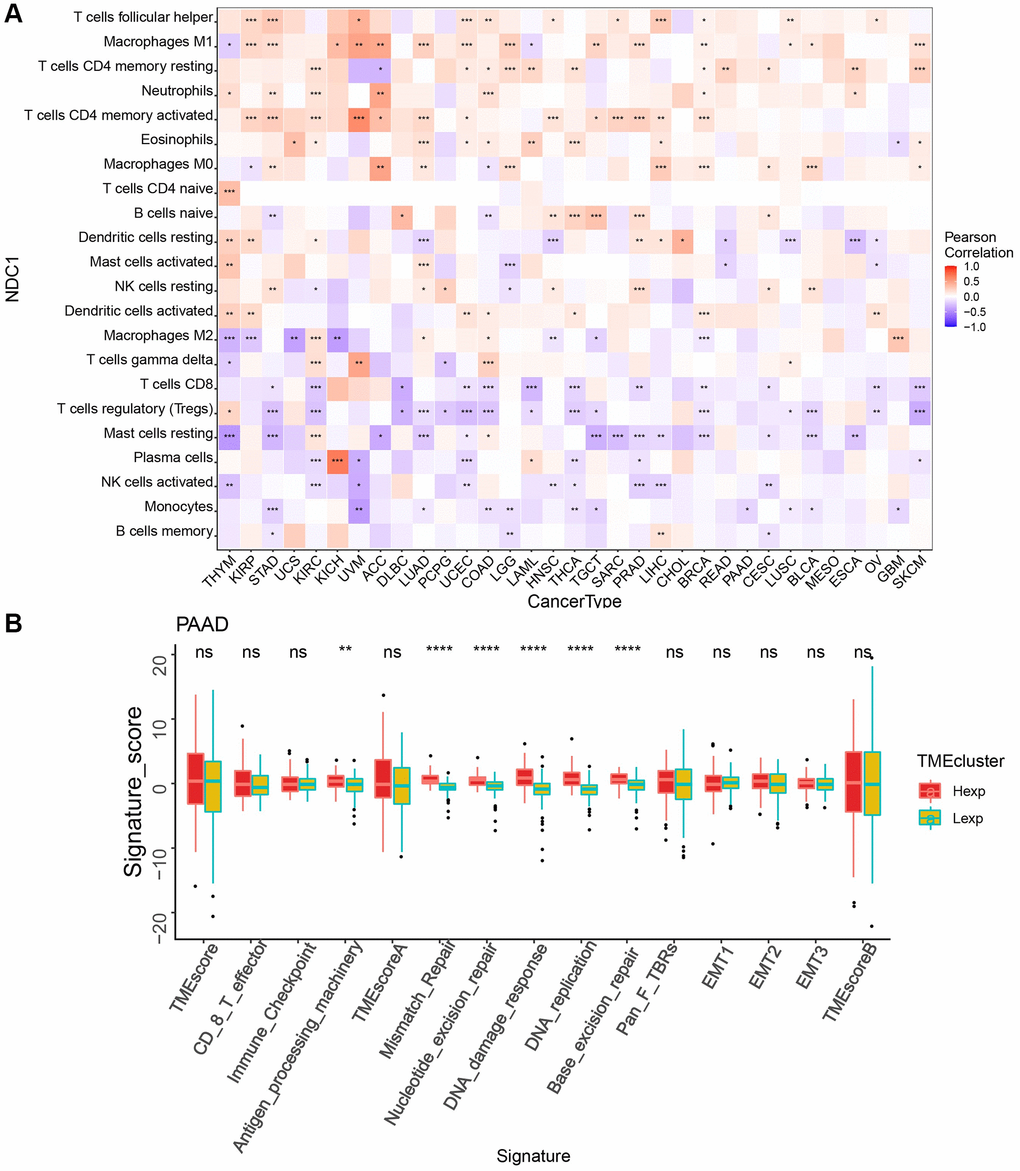
Figure 3.(A) Correlation between NDC1 expression and immune cell infiltration (CIBERSORT) (red represents positive correlation, and blue represents negative correlation). (B) TME analysis in PAAD (red for high-expression and yellow-green for low-expression).