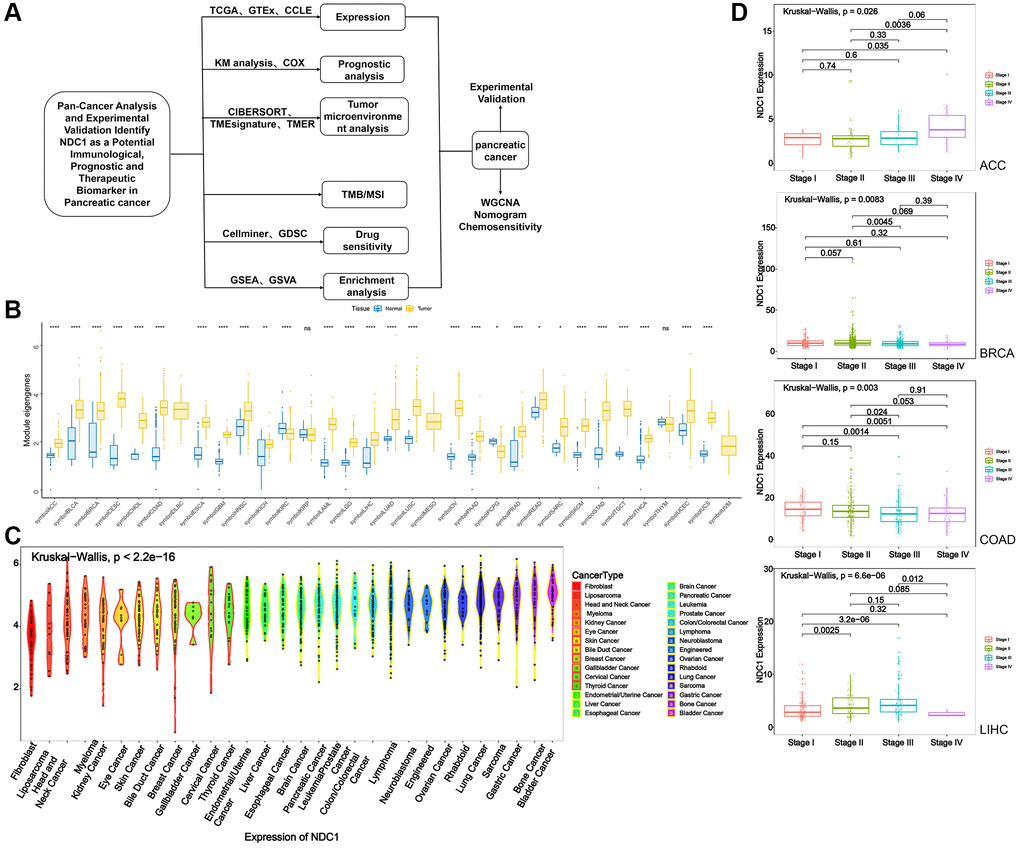
Figure 1.(A) Flowchart. (B) Expression of NDC1 in pan-cancer based on TCGA and GTEx databases (yellow for tumor tissue and blue for normal tissue). (C) Expression of NDC1 in different cell lines from the CCLE database. (D) Relationship between NDC1 expression and tumor stage in ACC, BRCA, COAD and LIHC.