Submit an Article
Navigate
Home
Editorial Board
Editorial Policies
Current Volume
Archive
Scientific Integrity
Publication Ethics Statements
Interviews with Outstanding Authors
Newsroom
Sponsored Conferences
Podcast
Contact
Special Collections
Submit an Article
Online ISSN: 1945-4589
Research Paper
|
Volume 15, Issue 18
|
pp. 9759–9778
Prognostic significance of
CTNNB1
mutation in hepatocellular carcinoma: a systematic review and meta-analysis
Back to article
Figure 3
(3 of 6)
−
100%
+
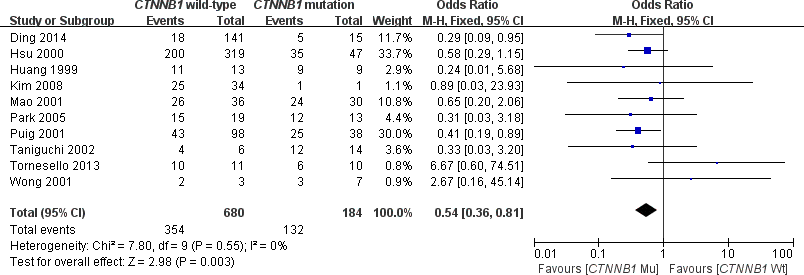
Figure 3.
Forest plot of odds ratio for the association of
CTNNB1
mutation with differentiation grade.