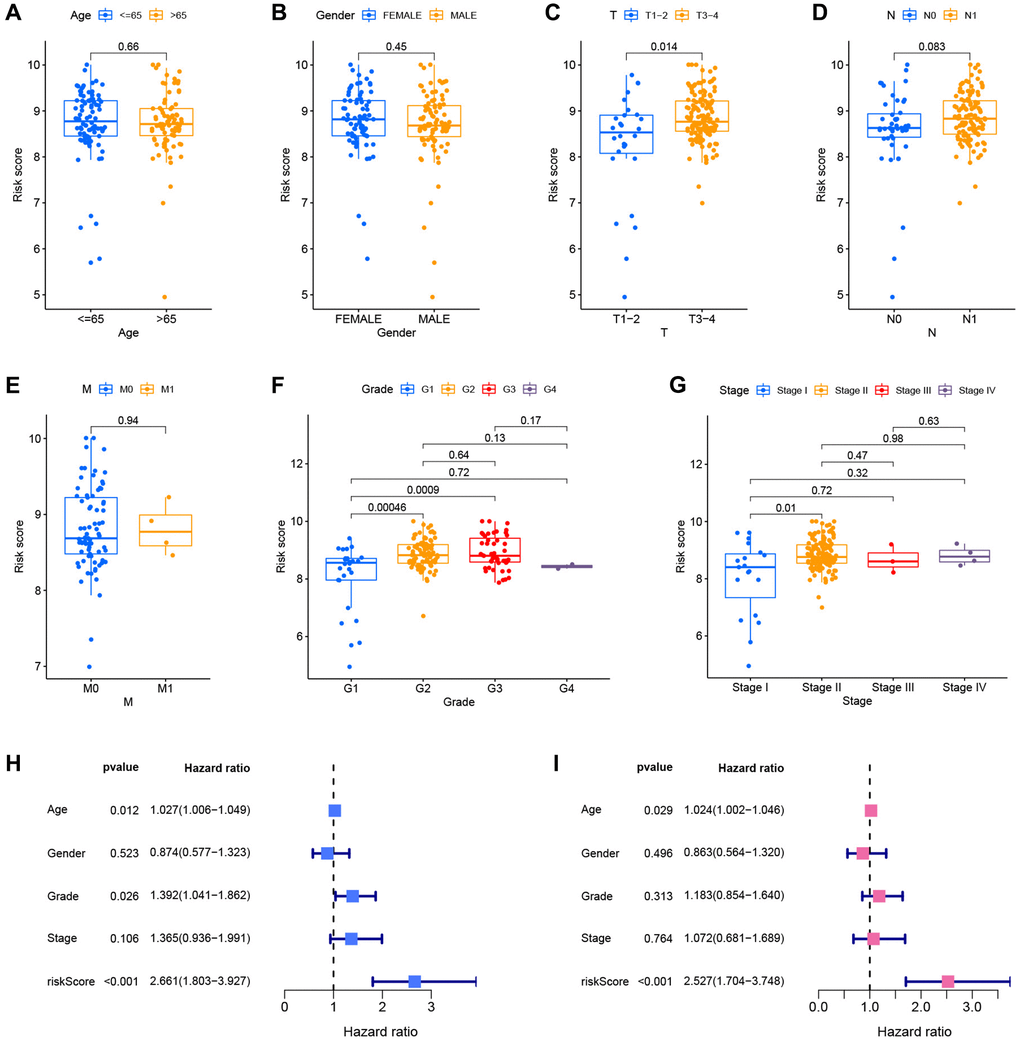
Figure 8.Correlation and independent prognostic analysis of clinical pathological features. Differential risk scores between age groups (A), gender groups (B), different T stages (C), different N stages (D), different M stages (E), different pathological grades (F), and different clinical stages (G). Forest plots of univariate Cox analysis (H) and multivariate Cox analysis results (I).