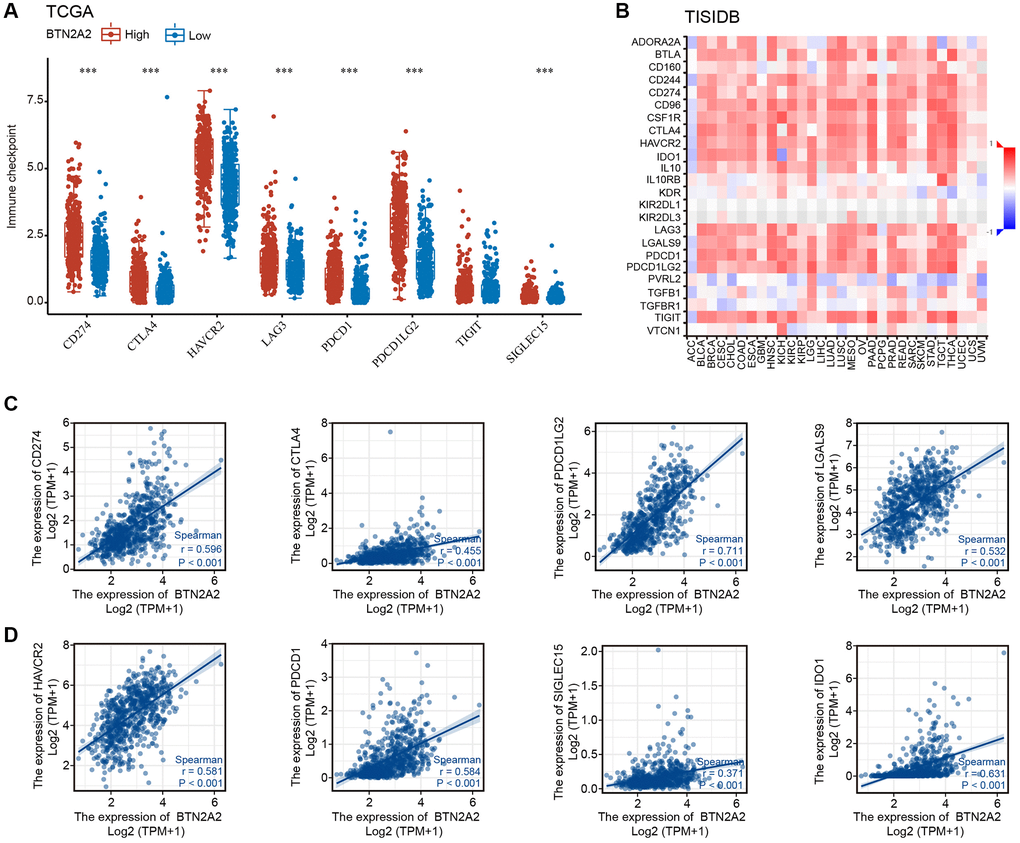
Figure 8.The correlation between BTN2A2 expression and immune checkpoint genes. (A, B) Correlation between BTN2A2 expression and immune checkpoint genes in patients with glioma using TCGA and TISIDB databases. (C, D) Analyzing the correlation between BTN2A2 expression and immune checkpoint genes in patients with glioma using Spearman’s correlation.