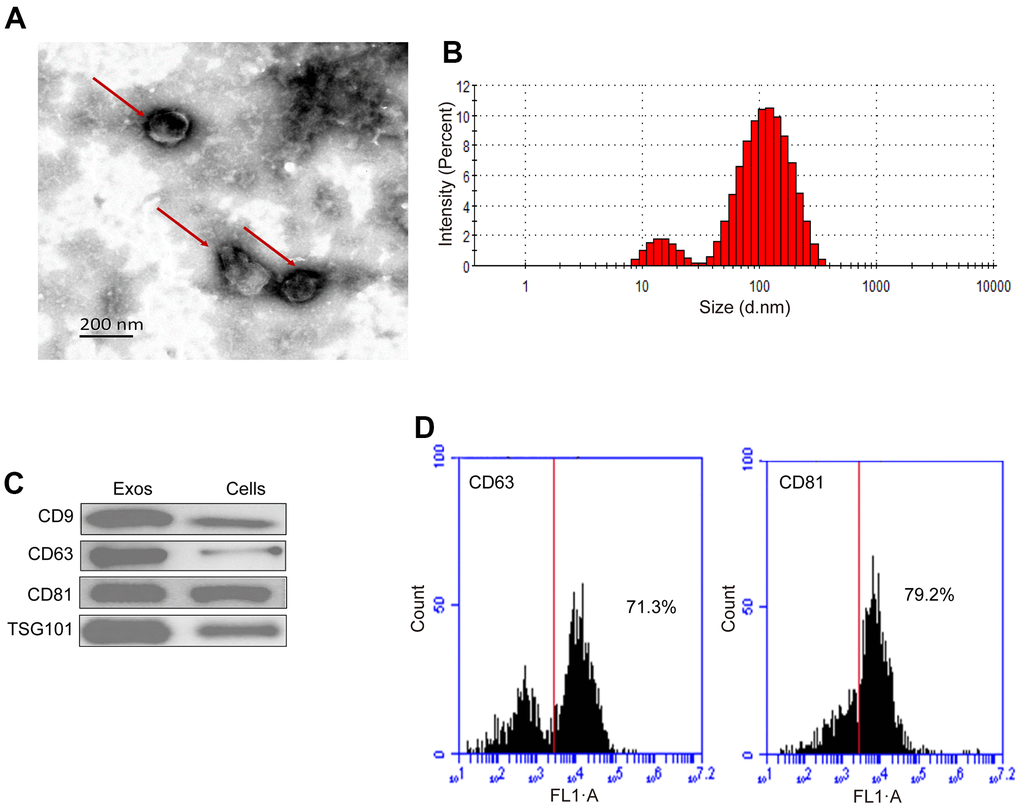
Figure 2.Characterization of hUC-MSCs-Exos. (A) Representative TEM images of hUC-MSCs-Exos. Scale bar=200 nm. (B) The particle size distribution of hUC-MSCs-Exos was detected by ZETASIZER Nano series-Nano-ZS. (C) Western blot detected the expression of exosomal markers (CD9, CD63, CD81 and TSG101). (D) Flow cytometry detected the proportion of expression of exosomal markers CD63 (71.3%) and CD81 (79.2%).