Submit an Article
Navigate
Home
Editorial Board
Editorial Policies
Current Volume
Archive
Scientific Integrity
Publication Ethics Statements
Interviews with Outstanding Authors
Newsroom
Sponsored Conferences
Podcast
Contact
Special Collections
Submit an Article
Online ISSN: 1945-4589
Research Paper
|
Volume 15, Issue 18
|
pp. 9521–9543
Construction of a novel cancer-associated fibroblast-related signature to predict clinical outcome and immune response in colon adenocarcinoma
Back to article
Figure 11
(11 of 12)
−
100%
+
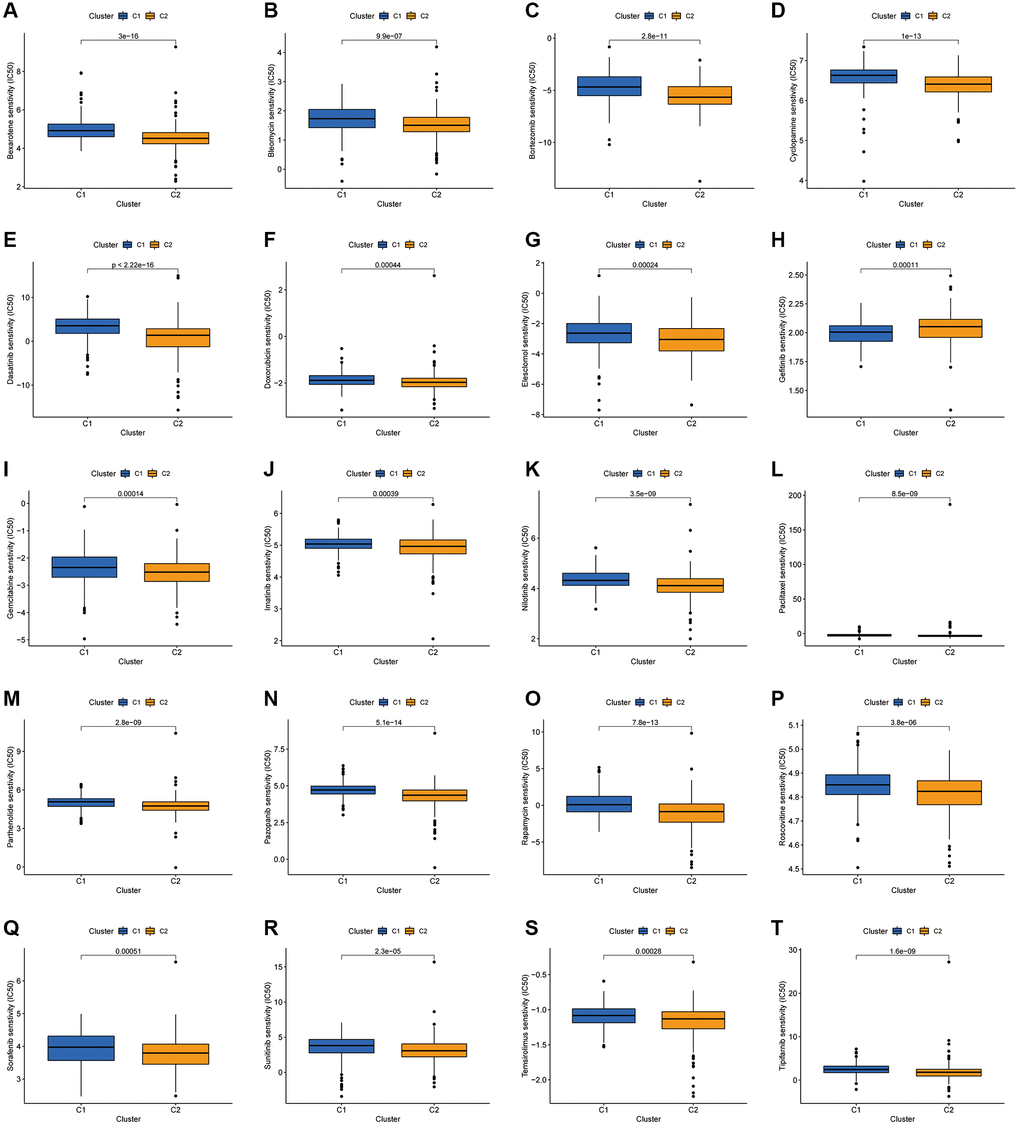
Figure 11.
Investigation of drug sensitivity.
(
A
–
T
) Boxplots of IC50 values for different agents in the two clusters.