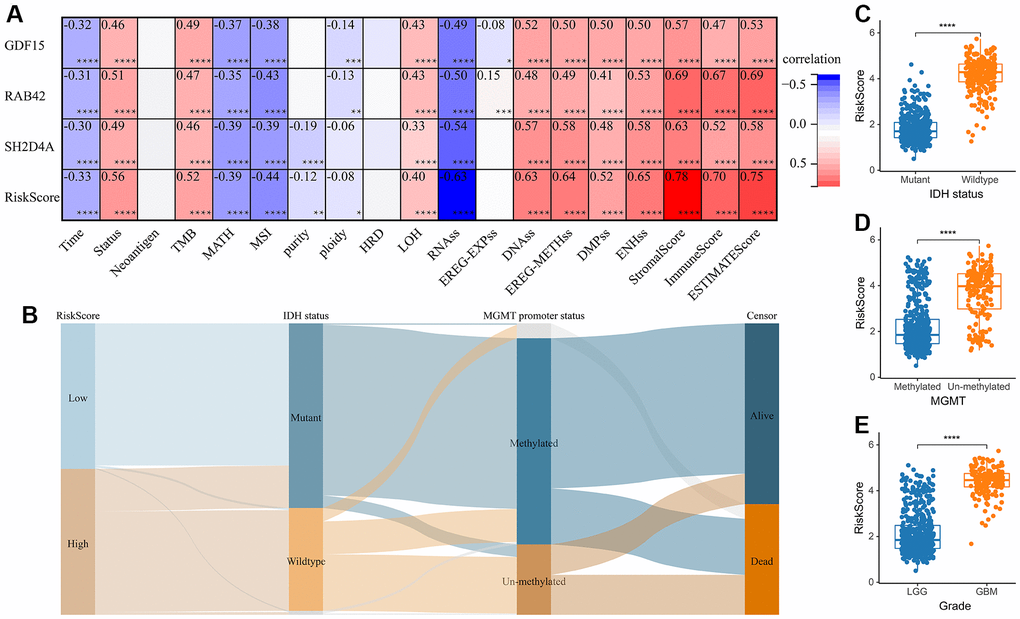
Figure 6.The relationship between risk score and clinical phenotype. (A) Correlations between 3 risk hub genes and tumor stemness, genomic heterogeneity, and immune microenvironment. (B) Sankey Diagram displayed the distribution of the survival status, IDH status, WHO grade, risk score and MGMT promoter status. (C) Analysis of the risk scores in different IDH status, (D) MGMT promoter status, and (E) WHO grades, respectively. *, P < 0.05; **, P < 0.01; ***, P < 0.001; ****, P < 0.0001.