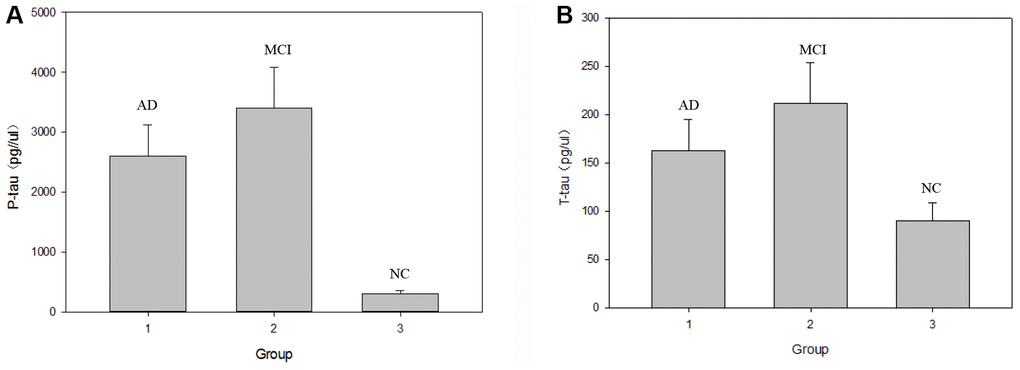
Figure 3.Comparison of serum P-tau-181 and T-tau protein levels in the NC, MCI and AD groups. Note: (A) graph shows the changes in serum P-tau-181 level in the three groups respectively. (B) graph shows the changes in serum T-tau level in the three groups respectively.