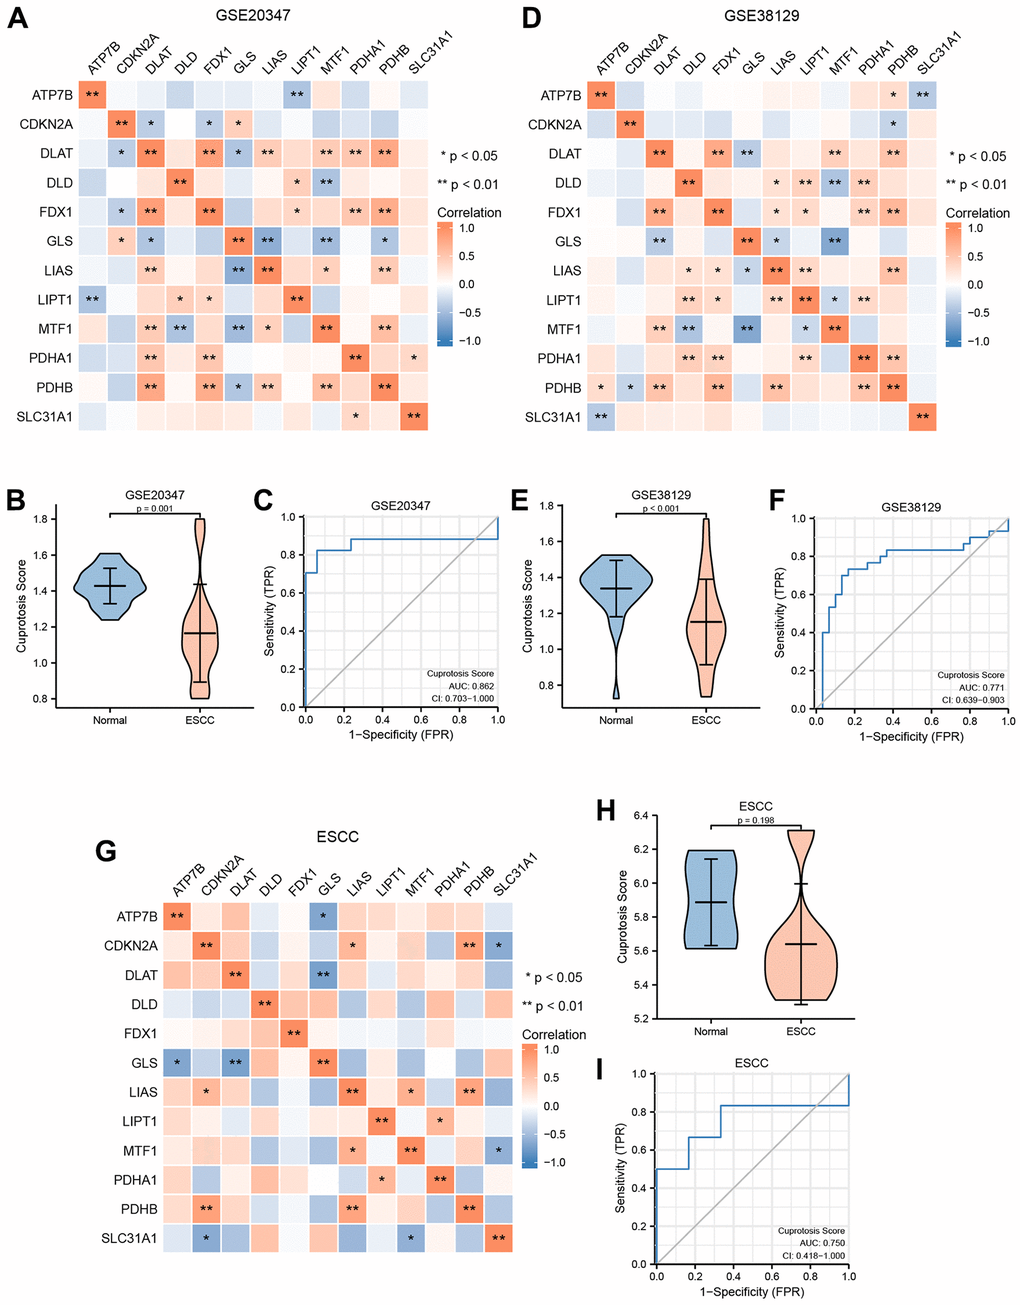
Figure 5.Construction of cuproptosis score diagnosis signature. (A) The heat map presented the correlation among the expression level of 12 CRGs in GSE20347 cohort. (B) Differential analysis of cuproptosis score between normal group and ESCC group in GSE20347 cohort. (C) ROC curves showed the diagnosis performance of GSE20347 cohort. (D) The heat map presented the correlation among the expression level of 12 CRGs in GSE38129 cohort. (E) Differential analysis of cuproptosis score between normal group and ESCC group in GSE38129 cohort. (F) ROC curves showed the diagnosis performance of GSE20347 cohort (C), GSE38129 cohort. (G) The heat map presented the correlation among the expression level of 12 CRGs in ESCC cohort. (H) Differential analysis of cuproptosis score between normal group and ESCC group in ESCC cohort. (I) ROC curves showed the diagnosis performance of ESCC cohort.