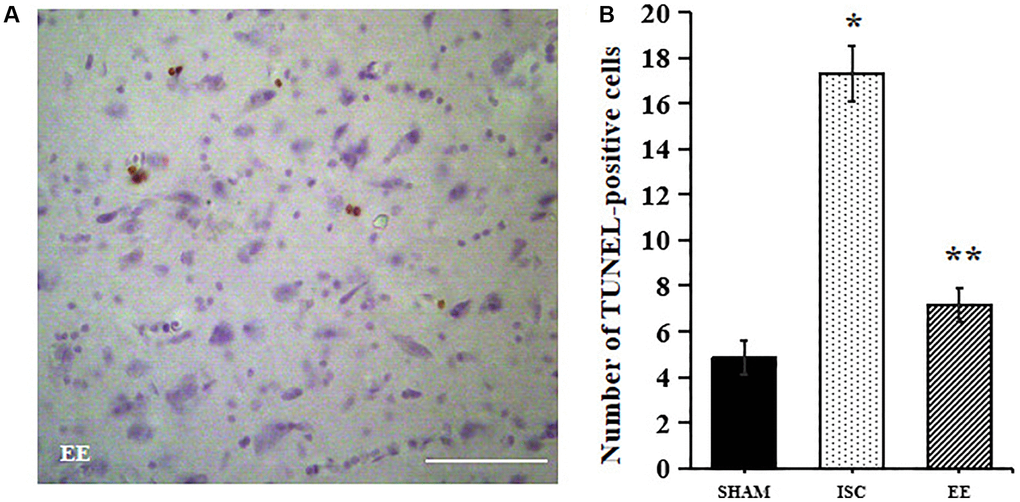
Figure 5.Apoptosis in the peri-infarct cortex. A Representative images for TUNEL-positive cells in the peri-infarct cortex. (A) Representative images for TUNEL-positive cells in the peri-infarct cortex. Scale bar = 50 μm. (B) Quantification of TUNEL-positive cells in the peri-infarct cortex (n = 6). Statistical significance: *P < 0.01 vs. SHAM, **P < 0.01 vs. ISC.