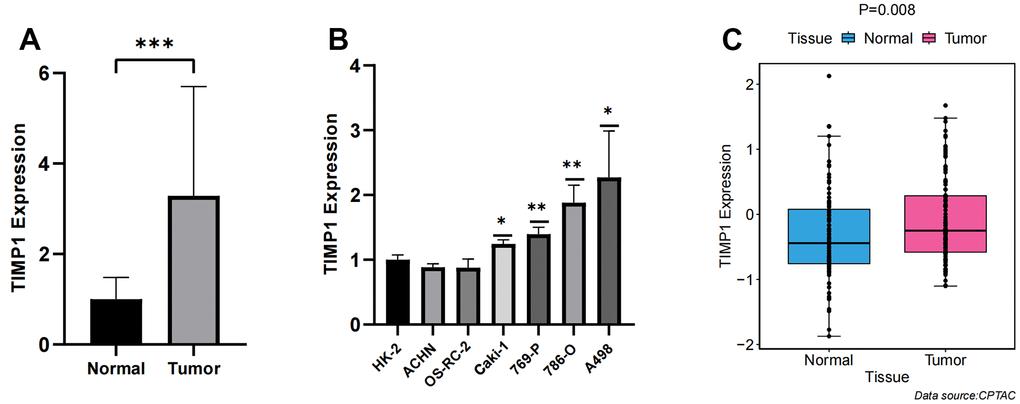
Figure 8.Verification of TIMP1 expression differences between carcinoma and adjacent tissue. (A) Bar plot for the relative expression of TIMP1 in ccRCC tissues and normal tissues; (B) Bar plot for the relative expression of TIMP1 in ccRCC and normal cell lines; (C) Difference of TIMP1 protein expression between ccRCC and adjacent tissues.