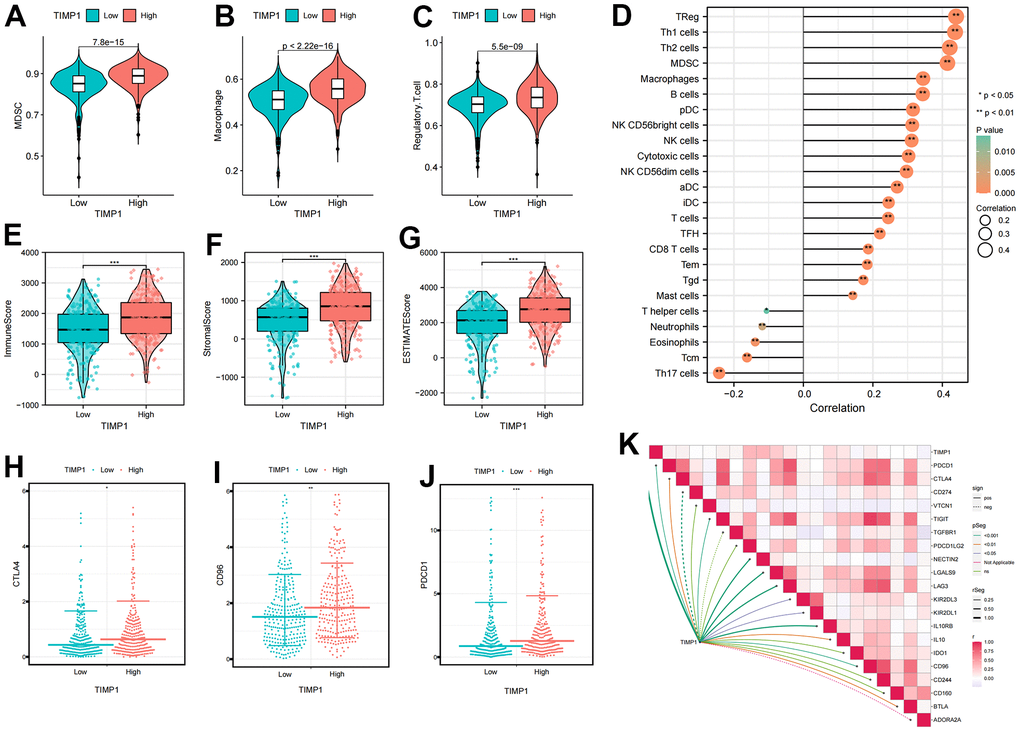
Figure 7.Identification the immune infiltration characteristics of TIMP1 in ccRCC. (A–C) The differential expression of immunosuppressive cells between high and low TIMP1 groups (A) MDSC; (B) Macrophage; (C) Regulatory.T.cell; (D) The correlation of TIMP1 expression profile with immune cells in ccRCC; (E–G) The differential expression of tumor microenvironment scores between high and low TIMP1 groups (E) ImmuneScore; (F) StromalScore; (G) ESTIMATEScore; (H–J) The differential expression of immune checkpoints between high and low TIMP1 groups (H) CTLA4; (I) CD96); (J) PDCD1; (K) The correlation of TIMP1 expression profile with immunosuppressive checkpoints in ccRCC.