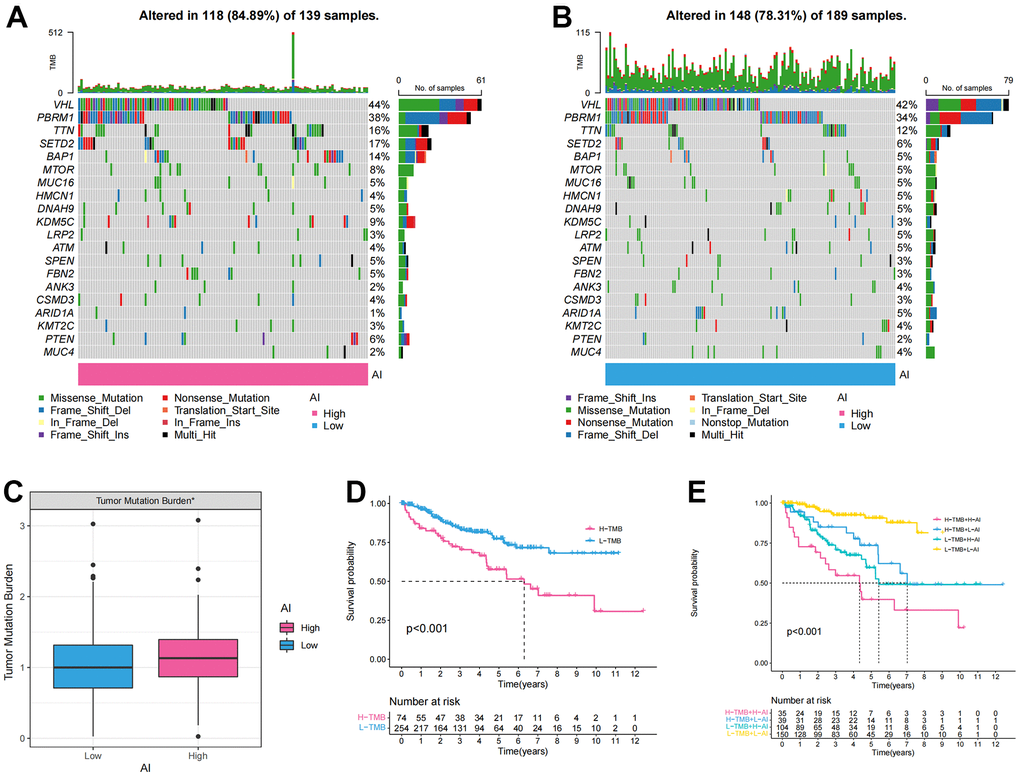
Figure 4.The tumor mutation burden characteristics of Anoikis index. (A, B) The waterfall chart showing the mutation frequency of the top 20 genes in the high and low AI groups; (C) Differences of the tumor mutation burden (TMB) between high and low AI groups; (D) KM survival curve showing the prognostic difference between high and low TMB groups; (E) KM survival curve showing OS of the combination of AI and TMB.