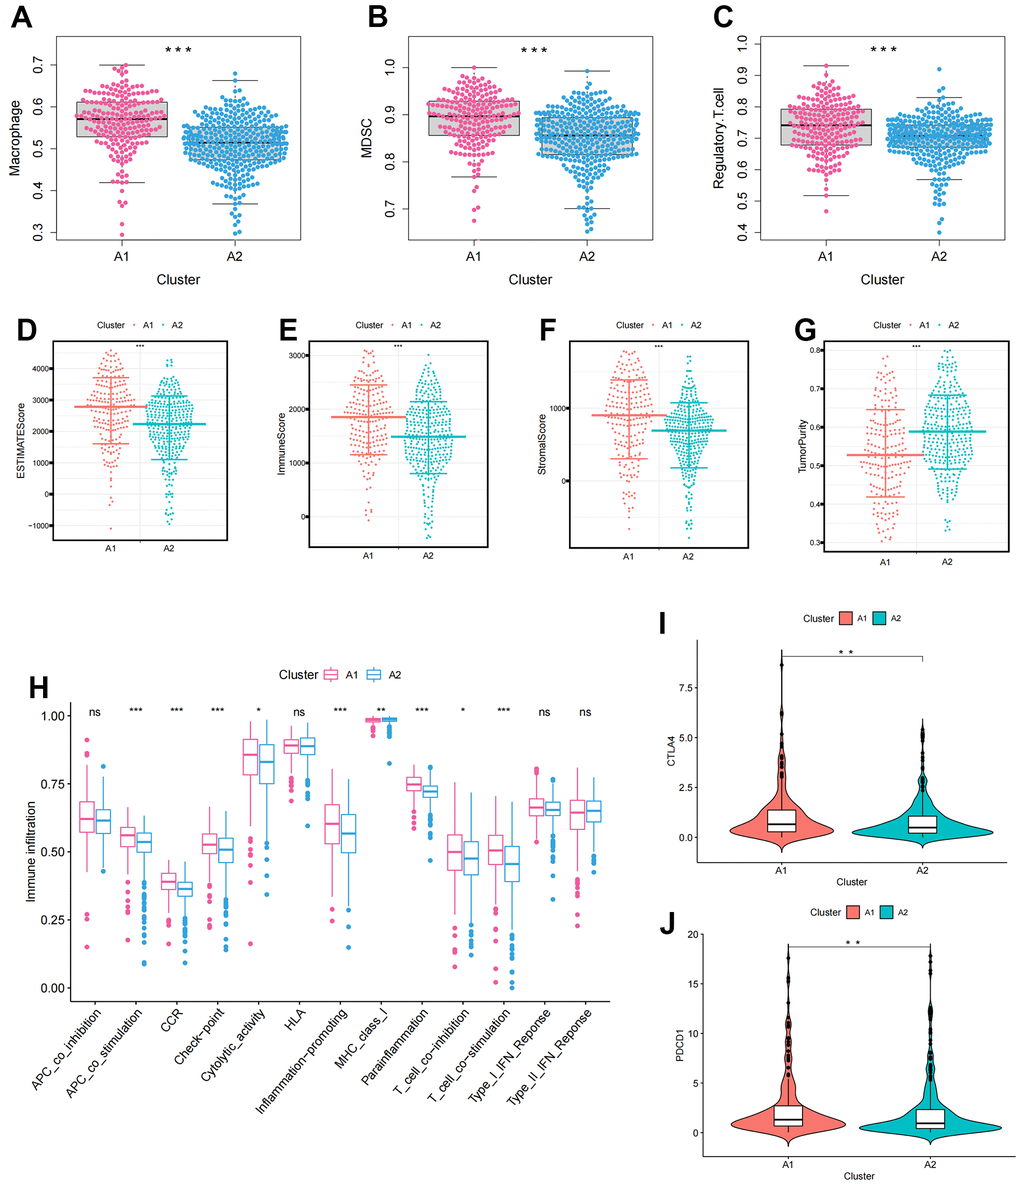
Figure 2.The immune infiltration characteristics in anoikis-related clusters. (A–C) The differential expression of immunosuppressive cells between clusters (A) Macrophage; (B) MDSC; (C) Regulatory.T.cell; (D–G) The differences in tumor microenvironment characteristics between clusters (D) ESTIMATEScore; (E) ImmuneScore; (F) StromalScore; (G) TumorPurity; (H) Boxplots showing the differences in immune function between clusters; (I, J) Differences in immune checkpoint expression between clusters (I) CTLA4; (J) PDCD1. The asterisks represented the statistical p-value (*p<0.05, **p<0.01, ***p<0.001).