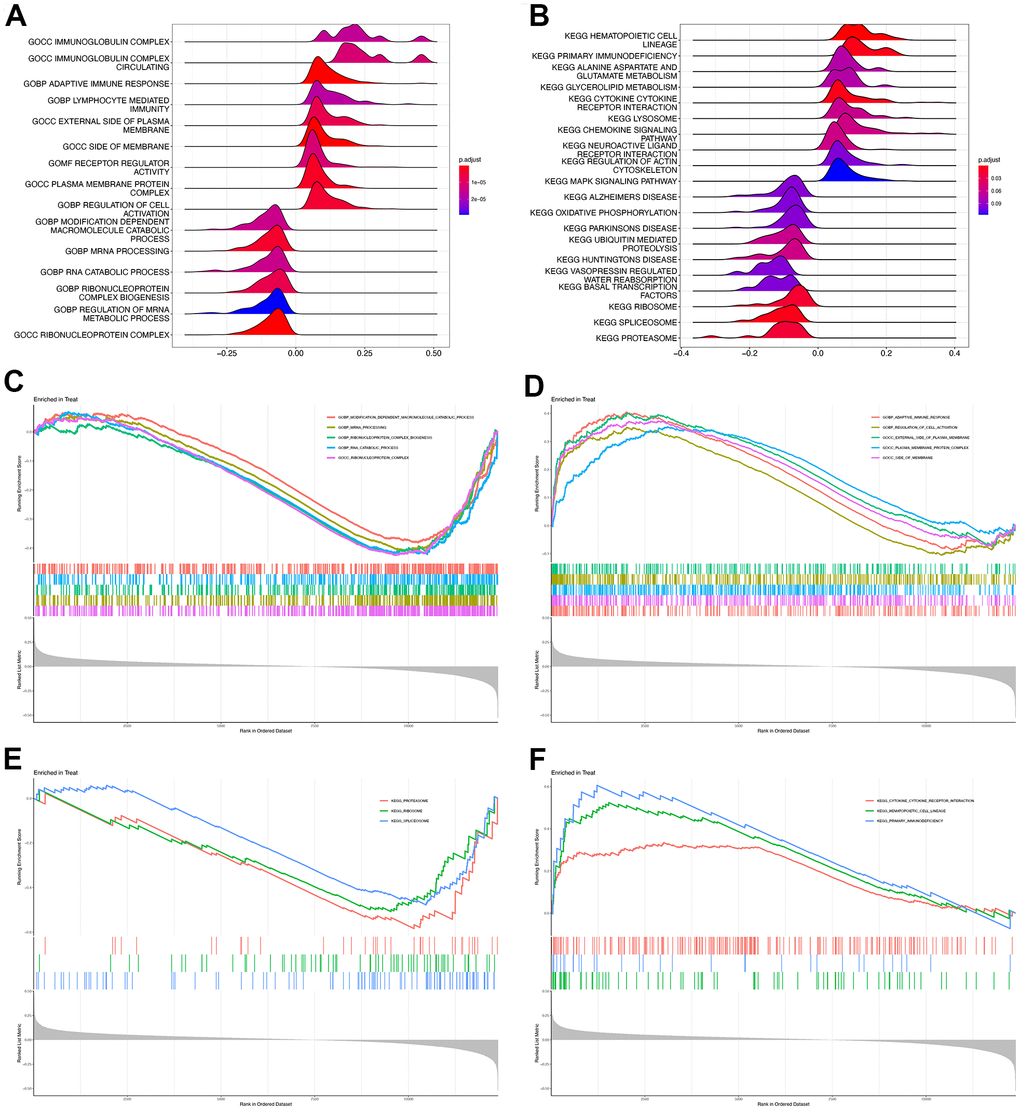
Figure 9.GSEA of high and low ROCK1 subgroup. Ridge map showed the GO (A) and KEGG (B) enrichment analysis results of all DEGs by GSEA. GSEA plot with DEGs and the top five GO terms enriched in high ROCK1 (C) and low ROCK1 (D) subgroup. GSEA plot with DEGs and the top three KEGG terms enriched in high ROCK1 (E) and low ROCK1 (F) subgroup.