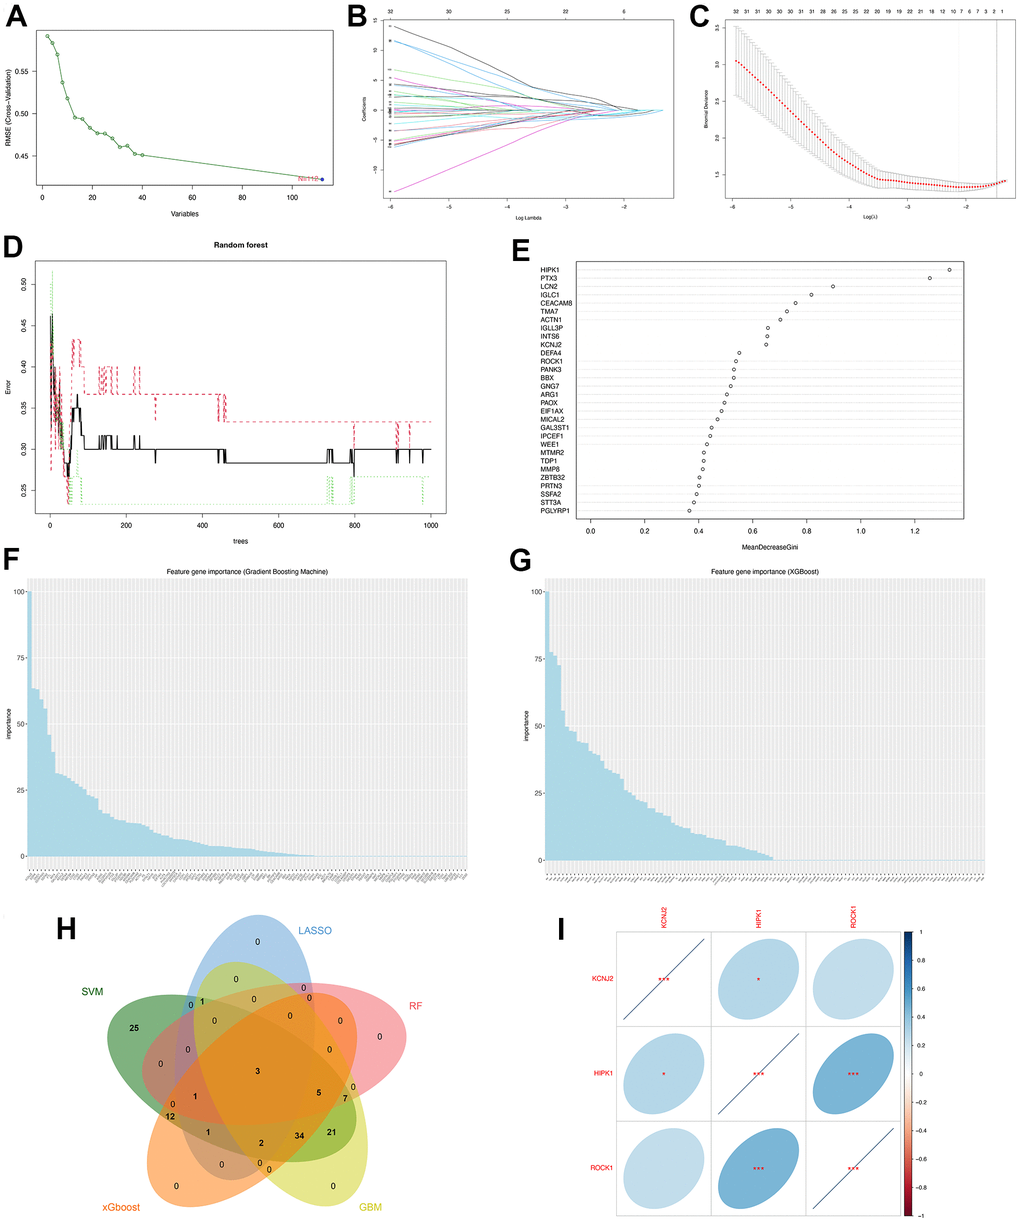
Figure 5.Machine learning identified three hub genes of PMOP. (A) SVM-RFE screening of candidate diagnostic genes. (B, C) LASSO screening of candidate diagnostic genes. (D) Random forest error rate versus the number of classification trees. (E) Random forest calculated the top 30 relatively important genes of PMOP. (F) GBM screening of candidate diagnostic genes and the bar chart showed the genes ranked by importance. (G) XGboost screening of candidate diagnostic genes and he bar chart showed the genes ranked by importance. (H) Venn plot between five machine learning methods resulted in three common hub genes. (I) Correlation between three hub genes. Blue represents positive correlations and red represents negative correlations. *, p < 0.05, **, p < 0.01, ***, p < 0.001.