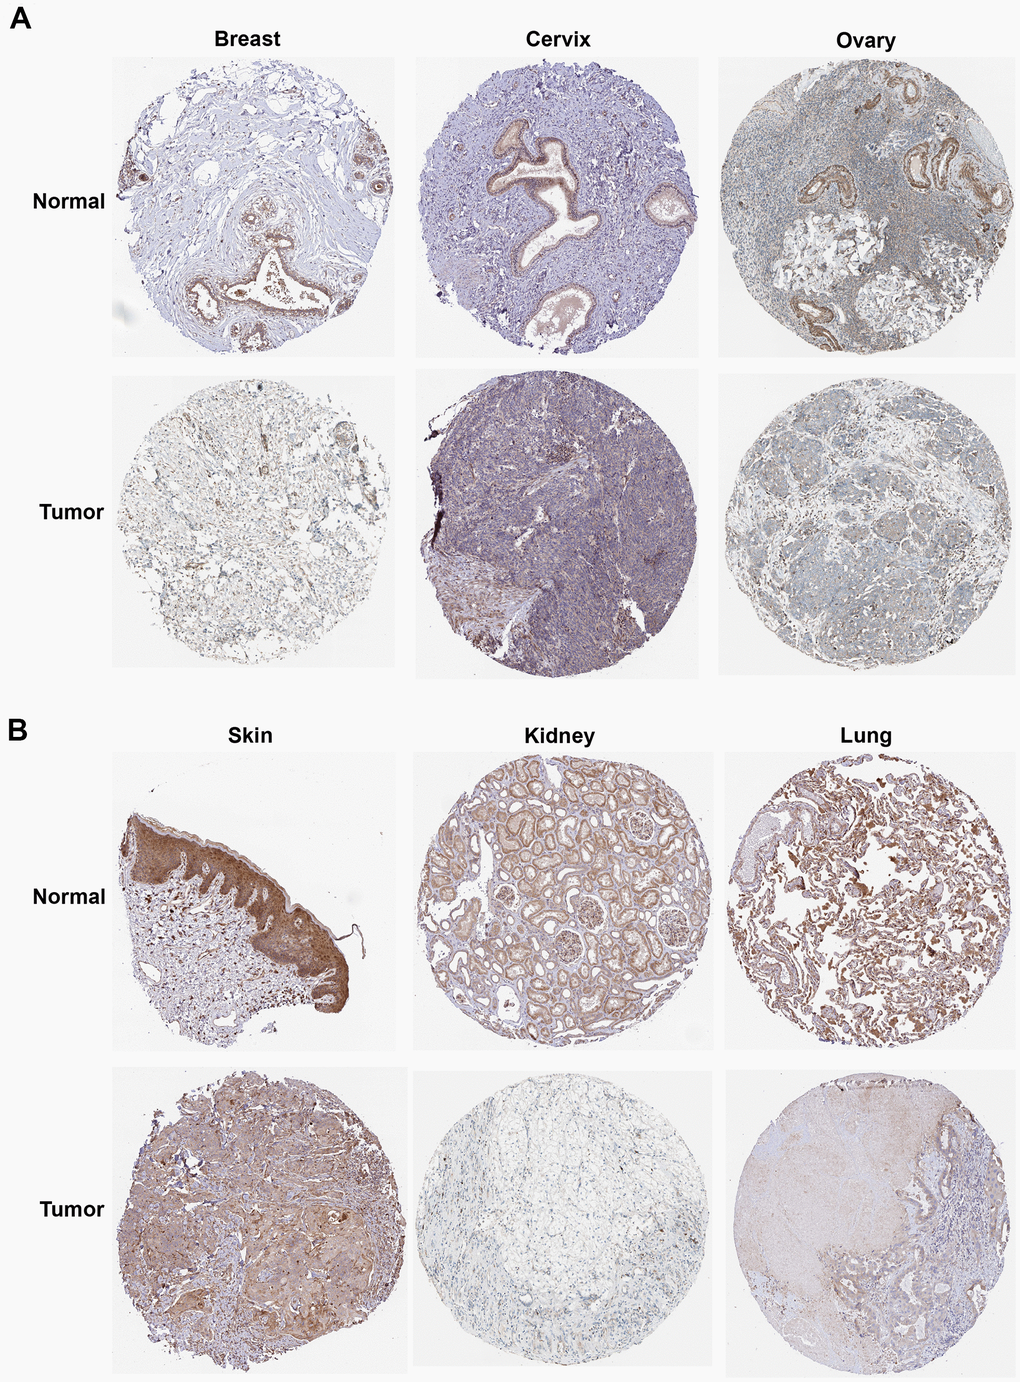
Figure 13.The protein expression of ROCK1 in pan-cancer. (A) The protein expression level of ROCK1 in women-specific cancers (Breast tumors, Cervical tumors, and Ovarian tumors versus normal tissues. (B) The protein expression level of ROCK1 in Skin tumors, Renal tumors, and Lung tumors versus normal tissues.