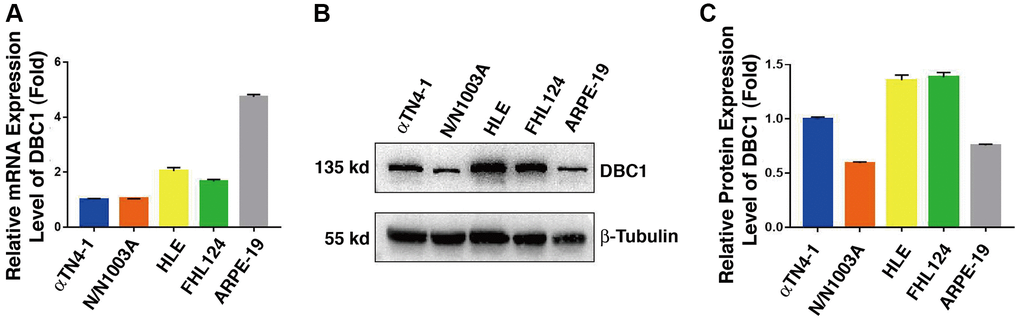
Figure 1.DBC1 expression patterns in different ocular cell lines. (A) Quantitative RT-PCR analysis showed mRNA levels of DBC1 in four different lens epithelial cell lines (αTN4-1, N/N1003A, HLE, FHL124) and one retinal pigment epithelial cell line (ARPE-19). Ct values were normalized by β-actin for each sample. The primers of DBC1 and β-actin were designed from mouse, rabbit and human species, the sequence details can refer to Supplementary Table 1. (B) Western blot analysis of DBC1 protein level in these ocular cell lines. β-tubulin served as the loading control. (C) Quantification of the Western blot results in panel (B).