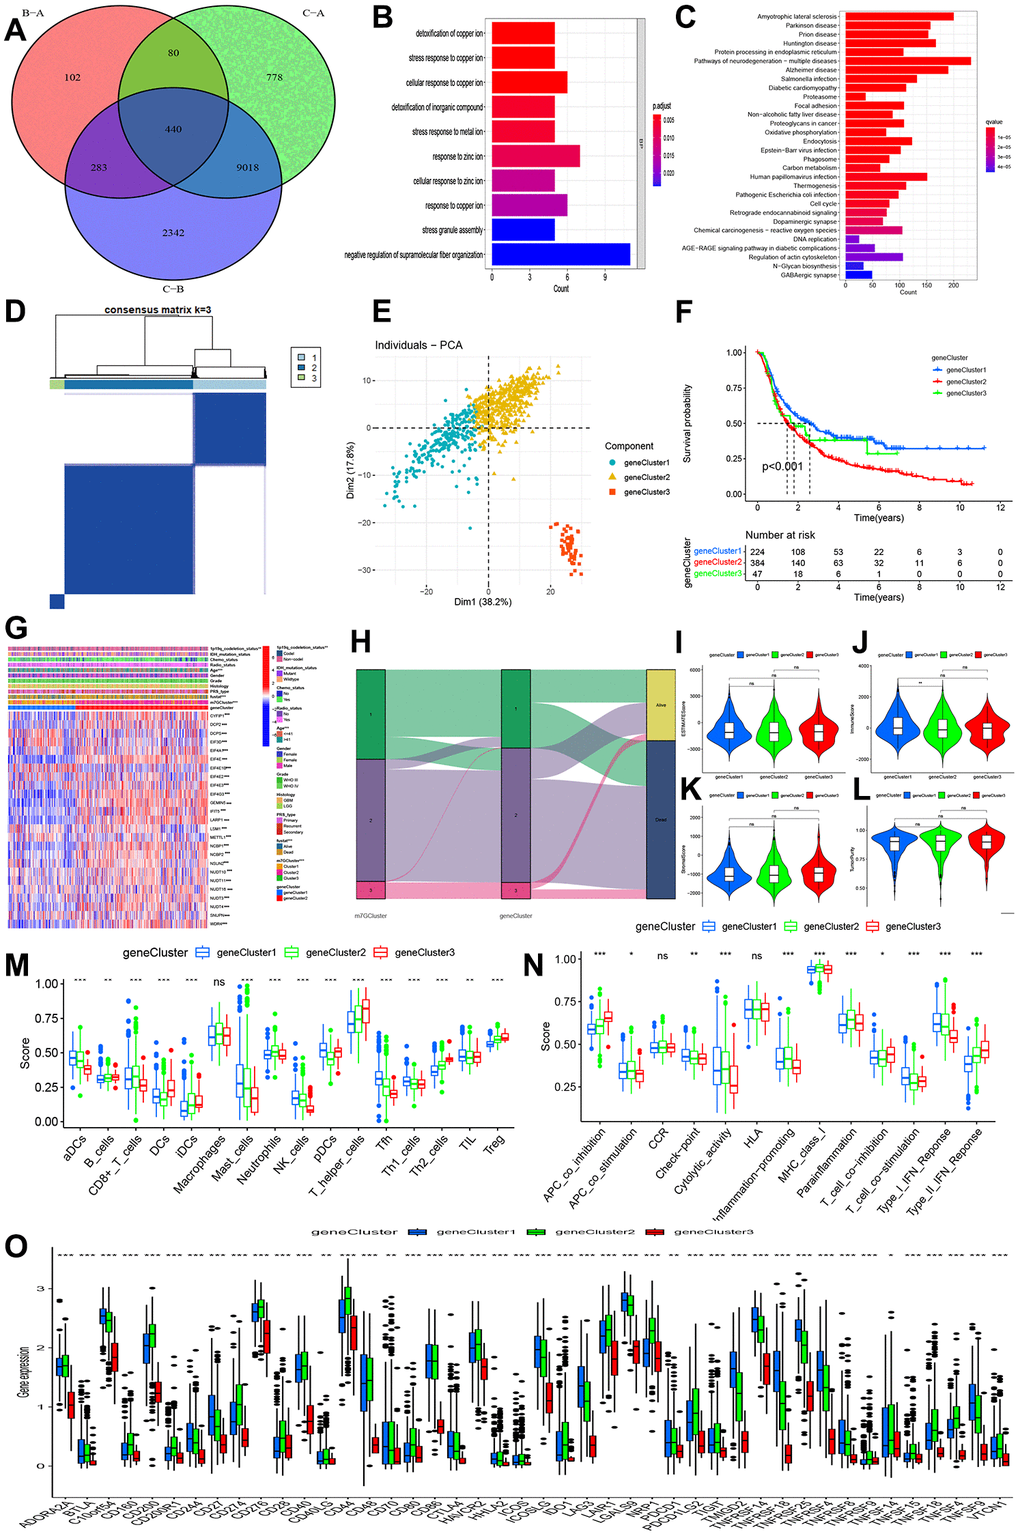
Figure 4.Identification of gene clusters-based DEGs among three m7G clusters. (A) Venn diagram indicating 440 DEGs among three m7G clusters. (B, C) GO and KEGG enrichment analyses based on 440 DEGs. (D) Consensus matrix identified the number of gene clustering. (E) PCA indicated three distinct gene clusters. (F) Kaplan-Meier analysis indicated significant differences in overall survival among three gene clusters. (G) Correlations of expression profiling, m7G clusters and gene clusters and clinical features. (H) Ggalluvial analysis indicated changes from m7G clusters to survival outcomes. (I–L) Differences in stromal, immune, estimate, and tumor purity. (M, N) Comparisons of immune cell infiltrations and immune functions. (O) Comparisons of immune checkpoint-related genes among three gene clusters.